Project Management

Jul 16, 2019 • 7 min read
Topic
Author
In This Blog
The rising popularity of agile has brought about a whole new set of challenges for modern project managers. From designing a productive sprint to managing the backlog, it takes a lot of learning to deliver your project on time.
Need a simple Gantt chart to visualize your projects and manage tasks better? We’ve created these Excel templates to help you get started.
But first, here’s a rundown of everything you need to know about working with Gantt charts.
Gantt charts in agile project management serve as the big-picture view of your business. They offer as much flexibility as you need to commit your plan through every iteration.
If your organization has been using modern tools like Jira for project management, you already know that agile and Gantt don’t naturally coexist. But they can, and should.
Because, as a project manager, your responsibilities involve big-picture planning and progress tracking, which is underappreciated in the world of agile.
Imagine what happens when scope creeps up? Say, features get pulled into the current sprint, or if someone in the team falls sick. How do you keep everyone on track and ensure alignment in accordance with those changes?
You may think that it’s as simple as reassigning tasks or rolling them into the next sprint.
But that’s not it.
You’ve got to reset the expectations with the stakeholders on the deliverables as well as the new completion date of the project. Team collaboration may turn into chaos because some tasks are dependent on the ones that were canceled.
As such, you now need to revise the project plan to reprioritize the new features against the pending tasks.
This is where Gantt charts really shine.
When creating a Gantt chart, make sure you have the three core components below:
The most popular use of Gantt charts is to break down a complex project into deliverable tasks. From there, you can manage the project in phases by identifying the milestones – or epics in agile practices.
By tracking the team’s progress towards these milestones, you’ll be able to visualize project schedules as well as dependencies for every sprint. Your team members can then prioritize their tasks around these milestones. These are also referred to as the “check points” to sign off tasks.
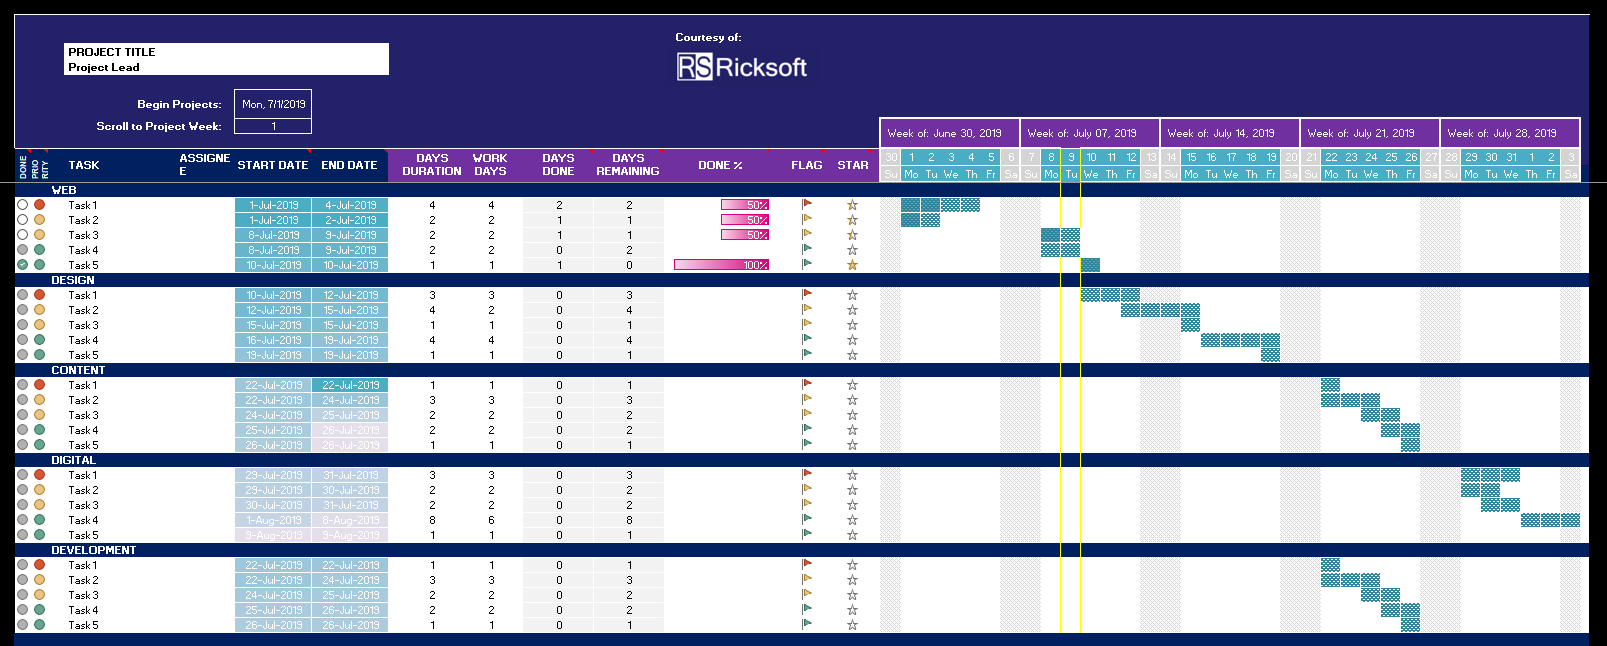
For instance, you can create a timeline for a website launch project with a milestone as below:
Read more: Crush Your Project Milestones with Jira Gantt Charts
Another major part of project management that agile leaves out is dependencies management.
When you do backlog refinement, you’d want to define all dependent tasks, and how they relate to each other. Doing so will help to avoid conflict when your team executes the project.
A common issue that happens if you overlook dependencies management is that teams often tangle with tasks. For instance, when the design team works ahead of content. Which means, they design based on intuition instead of looking at what message needs to be conveyed.
Gantt charts help to clear up the muddle by highlighting the relationship between them. You can simply create dependencies for the tasks that go into every sprint. That way, everyone understands what is expected of them and determines the most efficient collaborative workflow.
Read more: How to Visualize Dependencies in Jira?
As with agile, you can only track the sprint status. So, when it comes to a project report, that is – to state the expected completion date, or a list of features to be shipped, you need a bird’s-eye view of the entire plan.
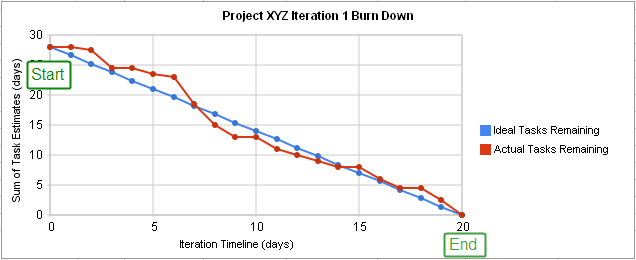
Presenting a sprint report on a burndown chart has its drawback. Since you only track the amount of work left to do in a given timeline, there is no way to tell what will happen behind the next curve.
In contrast, having the complete project plan visualized on a Gantt chart allows you to monitor its progress towards the project’s targeted ship date. It also makes it easier to explain the current project status to executive management.
Great! So how should I get started?
We’re glad you asked.
Below, we have designed and developed the most comprehensive Gantt chart templates for your teams. You can download and edit the fields to match your project requirements.
If you’re still reluctant to commit to a Gantt-enabled project management software, there is a simple way to experience the benefits of Gantt charts – for free.
Before the advent of modern project management software like Jira, there was Microsoft Excel. Even today, many project managers prefer the simplicity of Excel to manage their projects.
Yes, not all of us are Excel maniacs. Creating a Gantt chart in Excel may seem intimidating, even for veteran users.
Fortunately, there are plenty of ready-made Gantt chart templates available, making it very easy to get started.
We’ve developed the following Gantt chart templates for Excel, customized to fit your basic project needs.
Once you download the template, just start editing the fields and the charts will automatically update to reflect your project data.
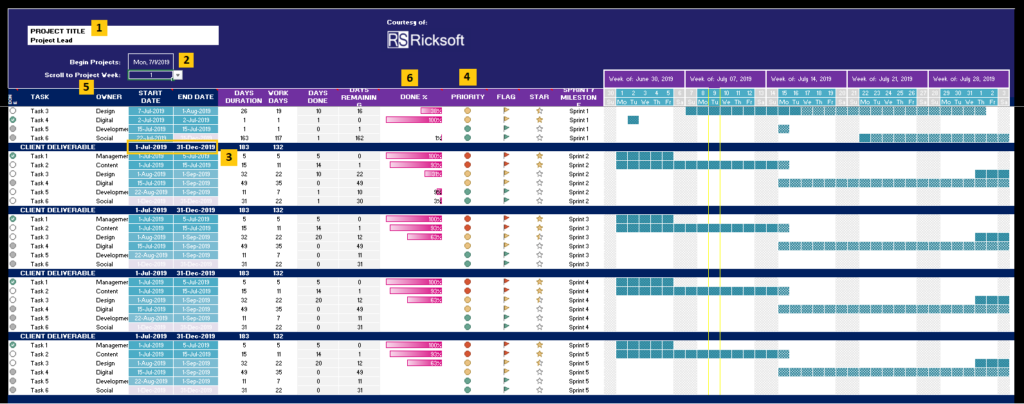
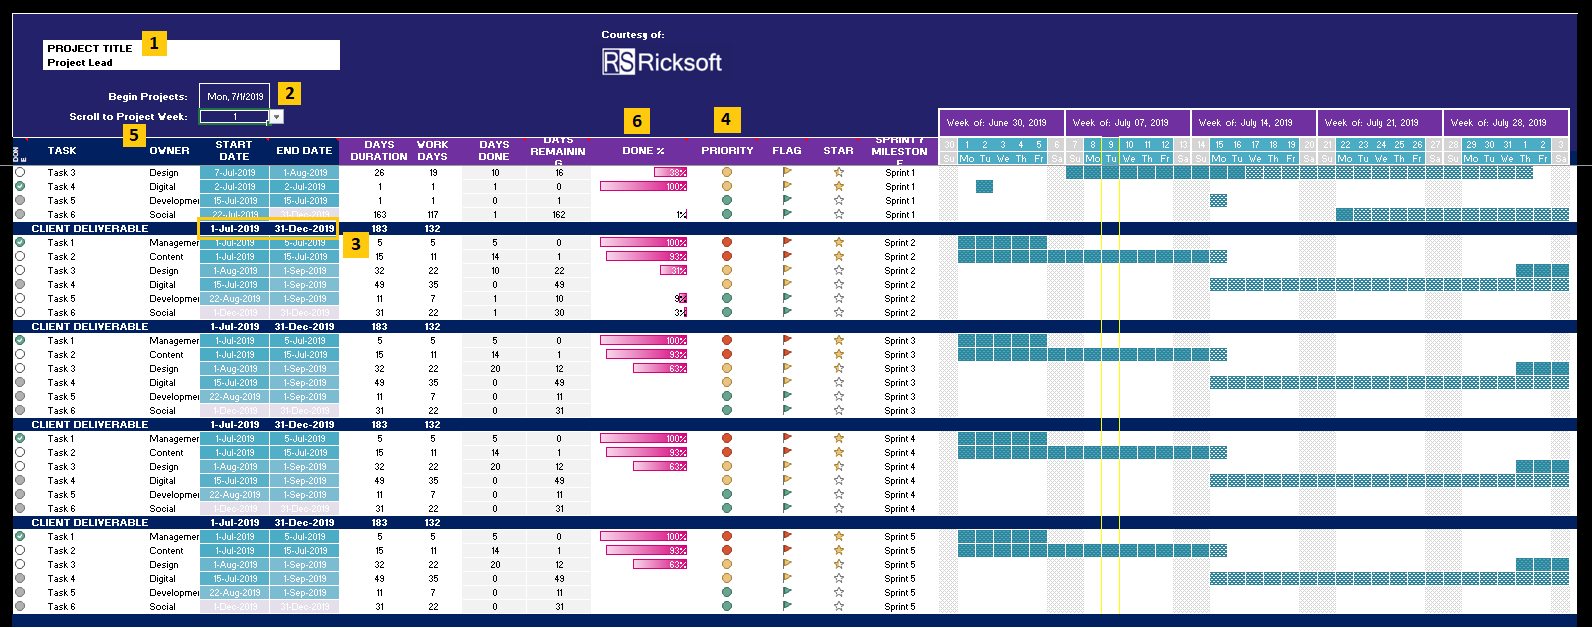
Here is the simple instruction to using our Excel Gantt Chart templates:
Adapted from Jira, this template allows you to manage your project in the iterative model. Simply copy and paste your product backlog into the respective sprint.
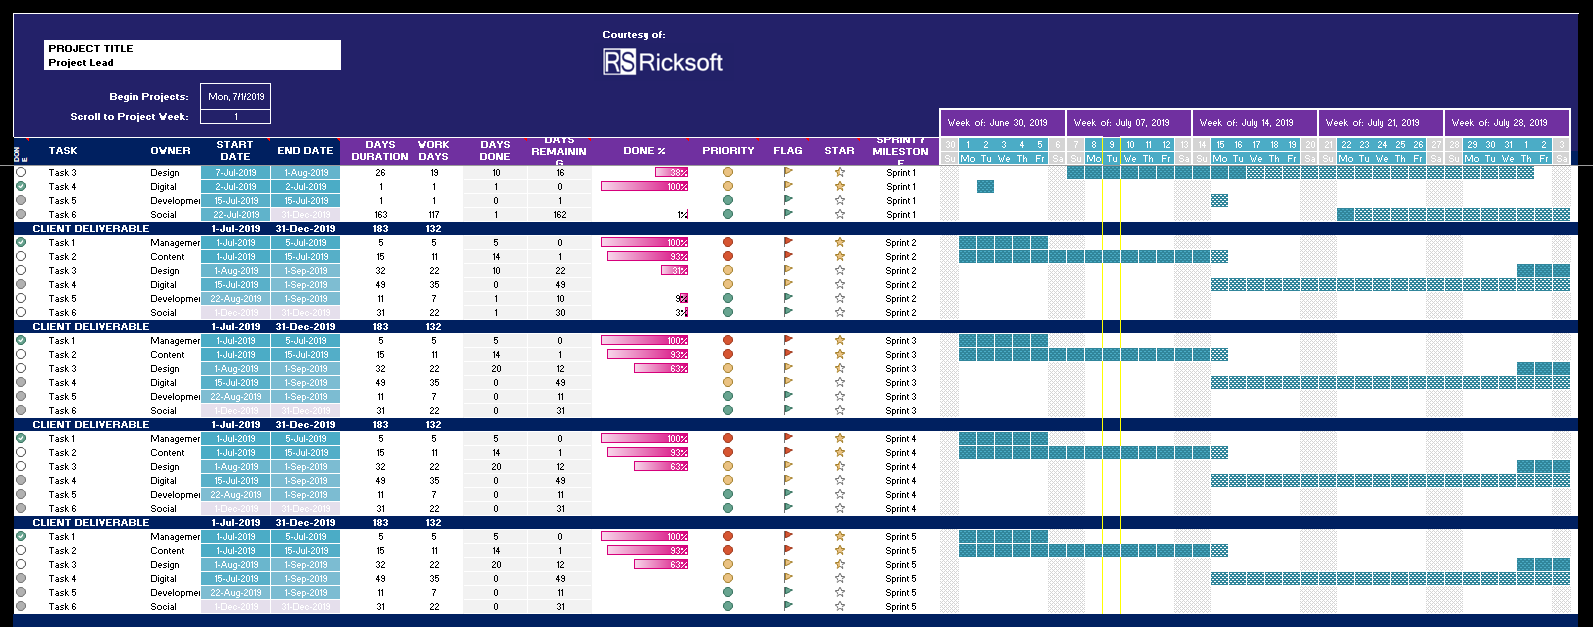
You can use this template to outline the complete marketing plan across multiple functions. The “Flag” feature is an indicator of go or no-go decisions. With this, you will always be able to align cross-functional teams on a single timeline.
Are you a Jira user who loves the simplicity of Excel? Then you should check out Excel-like Bulk Issue Editor for Jira. It lets you easily edit multiple Jira issues, without leaving Jira, using a built-in spreadsheet.
And that’s not all — with the Excel-like Tables for Jira add-on, you can also import Excel files, utilize formulas and of course, create tables to suit your project’s needs!
With these Gantt chart templates, you can present your complete project plan to stakeholders without having to walk them through your Jira boards. If required, you can also update the team’s progress on the Gantt charts to ensure on-time project delivery.
However, doing this manually can be time-consuming.
So, don’t just stop there.
Automate and streamline your planning process by powering up your Jira Software with our WBS Gantt-Chart app. This is the most powerful way to plan and track your agile projects on Jira. Alternatively, you can also consider incorporating your Gantt Chart Planner for Confluence if you’re looking for a similar experience but for Confluence instead.
Read our Complete Guide to Using Gantt Charts in Agile Project Management to learn more about project management best practices.