Empower your talents with advanced project visualization. Gantt charts offer a clear overview of schedules and resources, helping everyone stay on track. Spot blockers early on, keep stakeholders informed, and ensure projects finish on time, every time.


Discover how Gantt charts can address common project management challenges faced by enterprises of all sizes, enhancing productivity, collaboration, and decision-making.
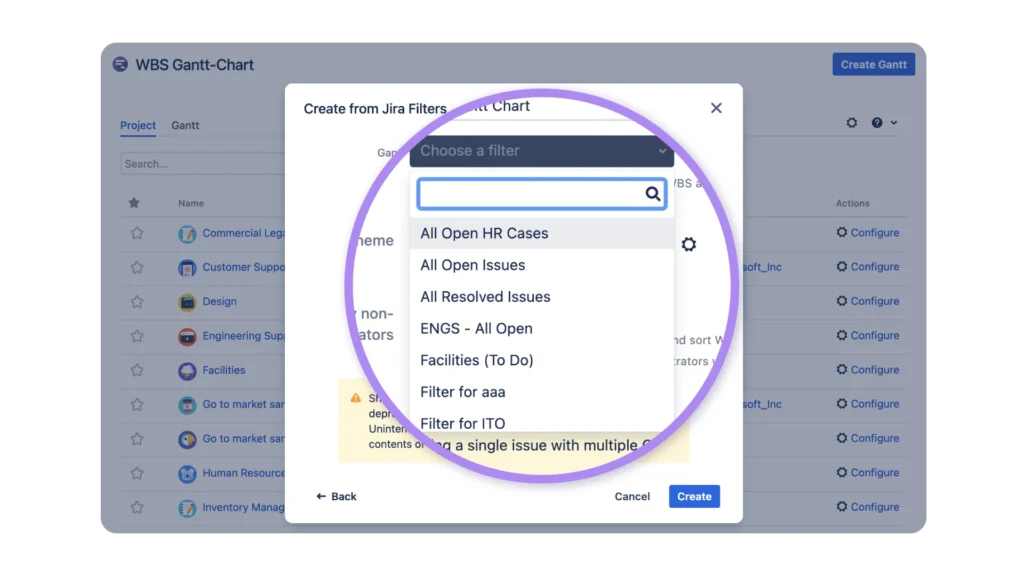
Sorting through Jira data can be overwhelming.
Gantt charts simplify it into one clear view—effortlessly track due dates, dependencies, and priorities in real-time to streamline your workflow.
Automatically populate your Gantt chart with relevant issues using saved filters or JQL for efficient project planning.
Establish unlimited parent-child relationships for better project organization, enabling clearer task management.
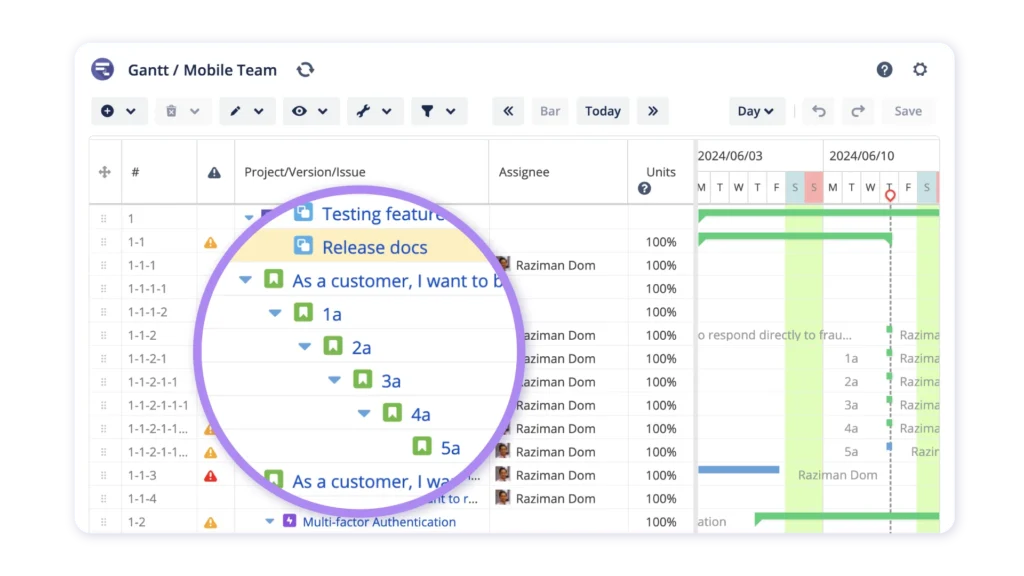
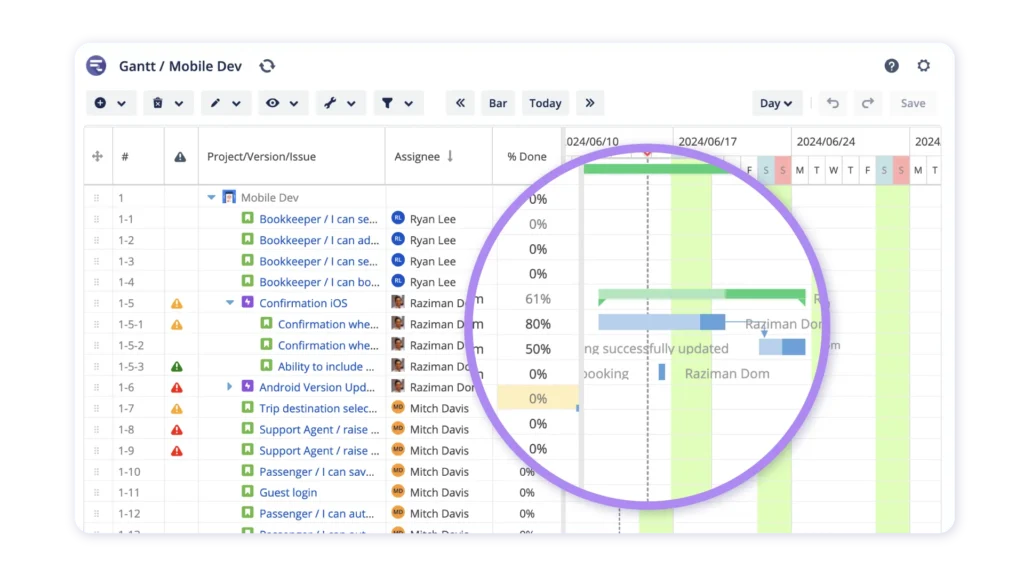
Go beyond Jira’s native roadmap overview. With a built-in Gantt Chart, view critical paths, highlight priorities, and identify bottlenecks instantly.
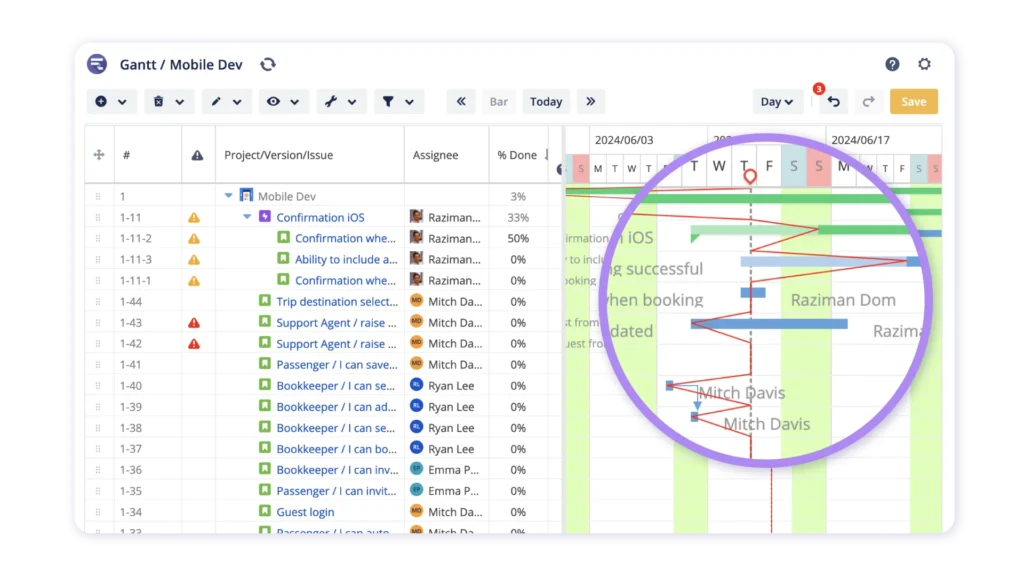
Highlight critical tasks in red to easily visualize dependencies and identify bottlenecks that could delay project timelines.
Use intuitive progress lines to quickly identify delays and take corrective actions to keep projects on track.
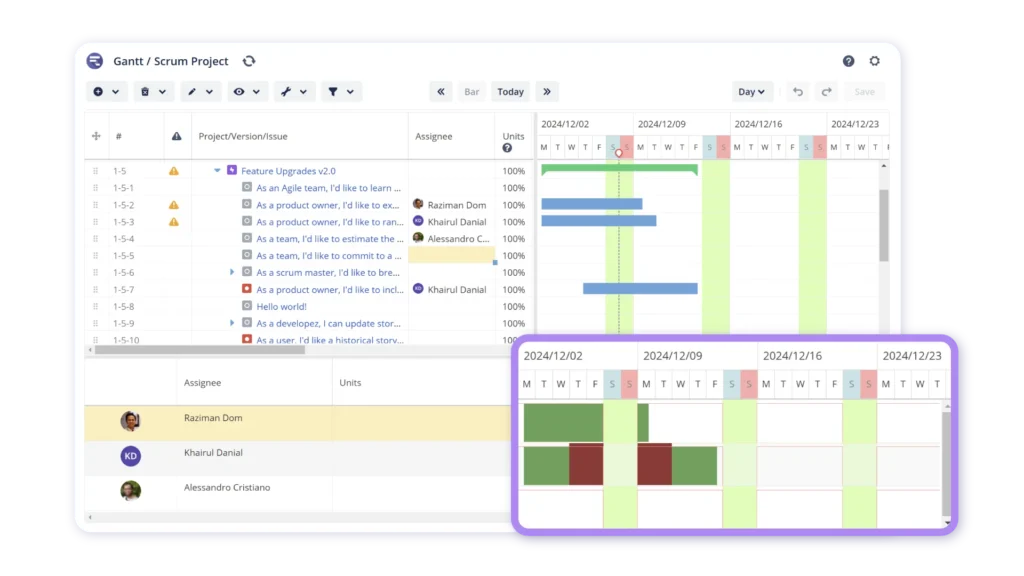
Managing resources without a centralized resource distribution function in Jira is tough.
That’s why features like Smart Workload Allocation and more are key for enterprise PMPs to optimize team productivity.
Get alerts when resources are overcommitted to instantly reallocate workload.
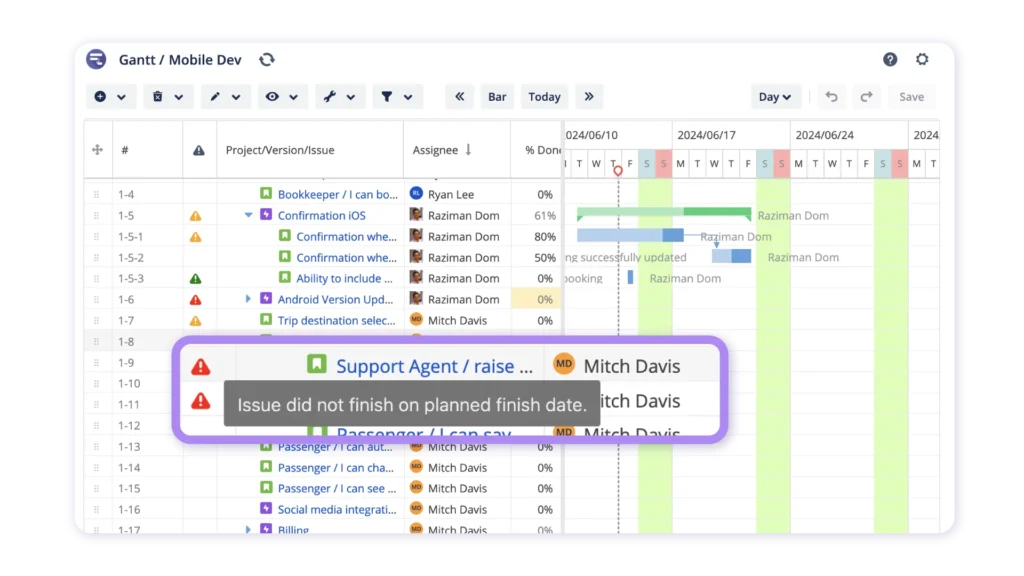
Receive real-time alerts for tasks falling behind schedule, enabling proactive adjustments and reducing risks.
Adjust schedules automatically for dependent tasks, ensuring seamless transitions as project dynamics change.
Securing project success requires effective tracking.
Gantt charts give you all the tools you need to monitor progress and maintain control, driving efficiency and informed decisions from start to finish.
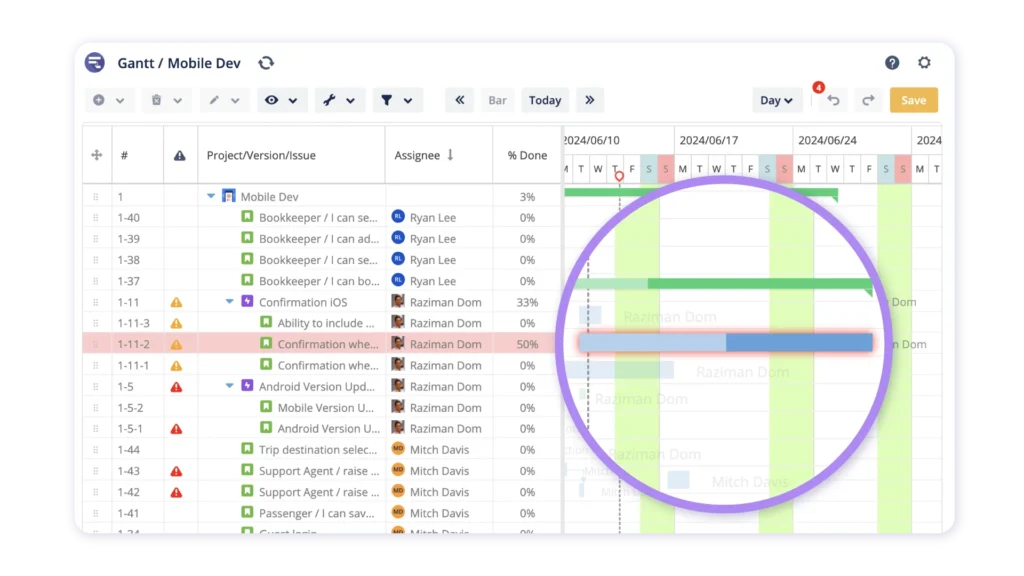
Establish a baseline for your project to monitor deviations and adjust plans effectively.
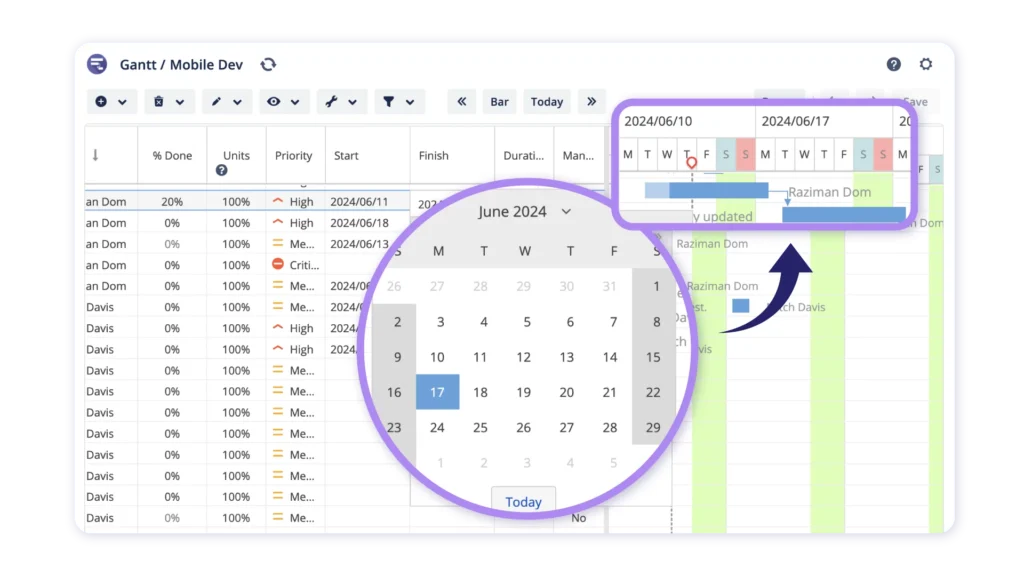
Easily adjust timelines with drag-and-drop functionality, while automatic calculations help you forecast completion dates accurately.


In the Atlassian Marketplace. For any Jira deployment.
With all features available.