Project Management

Dec 3, 2021 • 5 min read

In This Blog
Confluence is a powerful solution for project managers (PMs) and for a good reason. It offers a vast array of functionalities when it comes to sharing knowledge, from collaborative editing to document organization. However, one of its greatest weaknesses is that it isn’t equipped with everything a PM may need. A key tool for project management is the Gantt chart and with Confluence as is, creating a Confluence Gantt chart isn’t as straightforward as you’d hope.
In our article, we’ll go over some of our issues with Confluence before guiding you through how you can make your own Gantt charts in Confluence.
While Confluence may be fantastic for creating and managing a knowledge base, it isn’t perfect. There may be more praise than complaints but we’ve noticed a couple of issues worth griping over.
One way to get around Confluence’s lack of Gantt chart integration is by using its Roadmap Planner Macro. Though it is an excellent planner for small teams, it is also very lightweight. While you’ll be able to create clear plans and make edits along the way, you’ll quickly notice that it lacks the raw power of a Gantt chart. For instance, you won’t be able to create dependencies between tasks and if you’re managing hundreds of factors, the roadmap simply won’t hold up to that much complexity.
By far our biggest issue with Confluence is how you aren’t able to create a Gantt chart without deferring to an external add-on. Confluence and Gantt charts go together as well as wine and cheese, so the fact that you can’t readily unite the two is a shame. Thankfully, there are ways to get around this, but not without help from external sources.
Creating Gantt charts in Confluence is simpler than you might think with the help of external apps. Right below, you’ll find two different ways to create Gantt Charts all within Confluence’s doorstep:
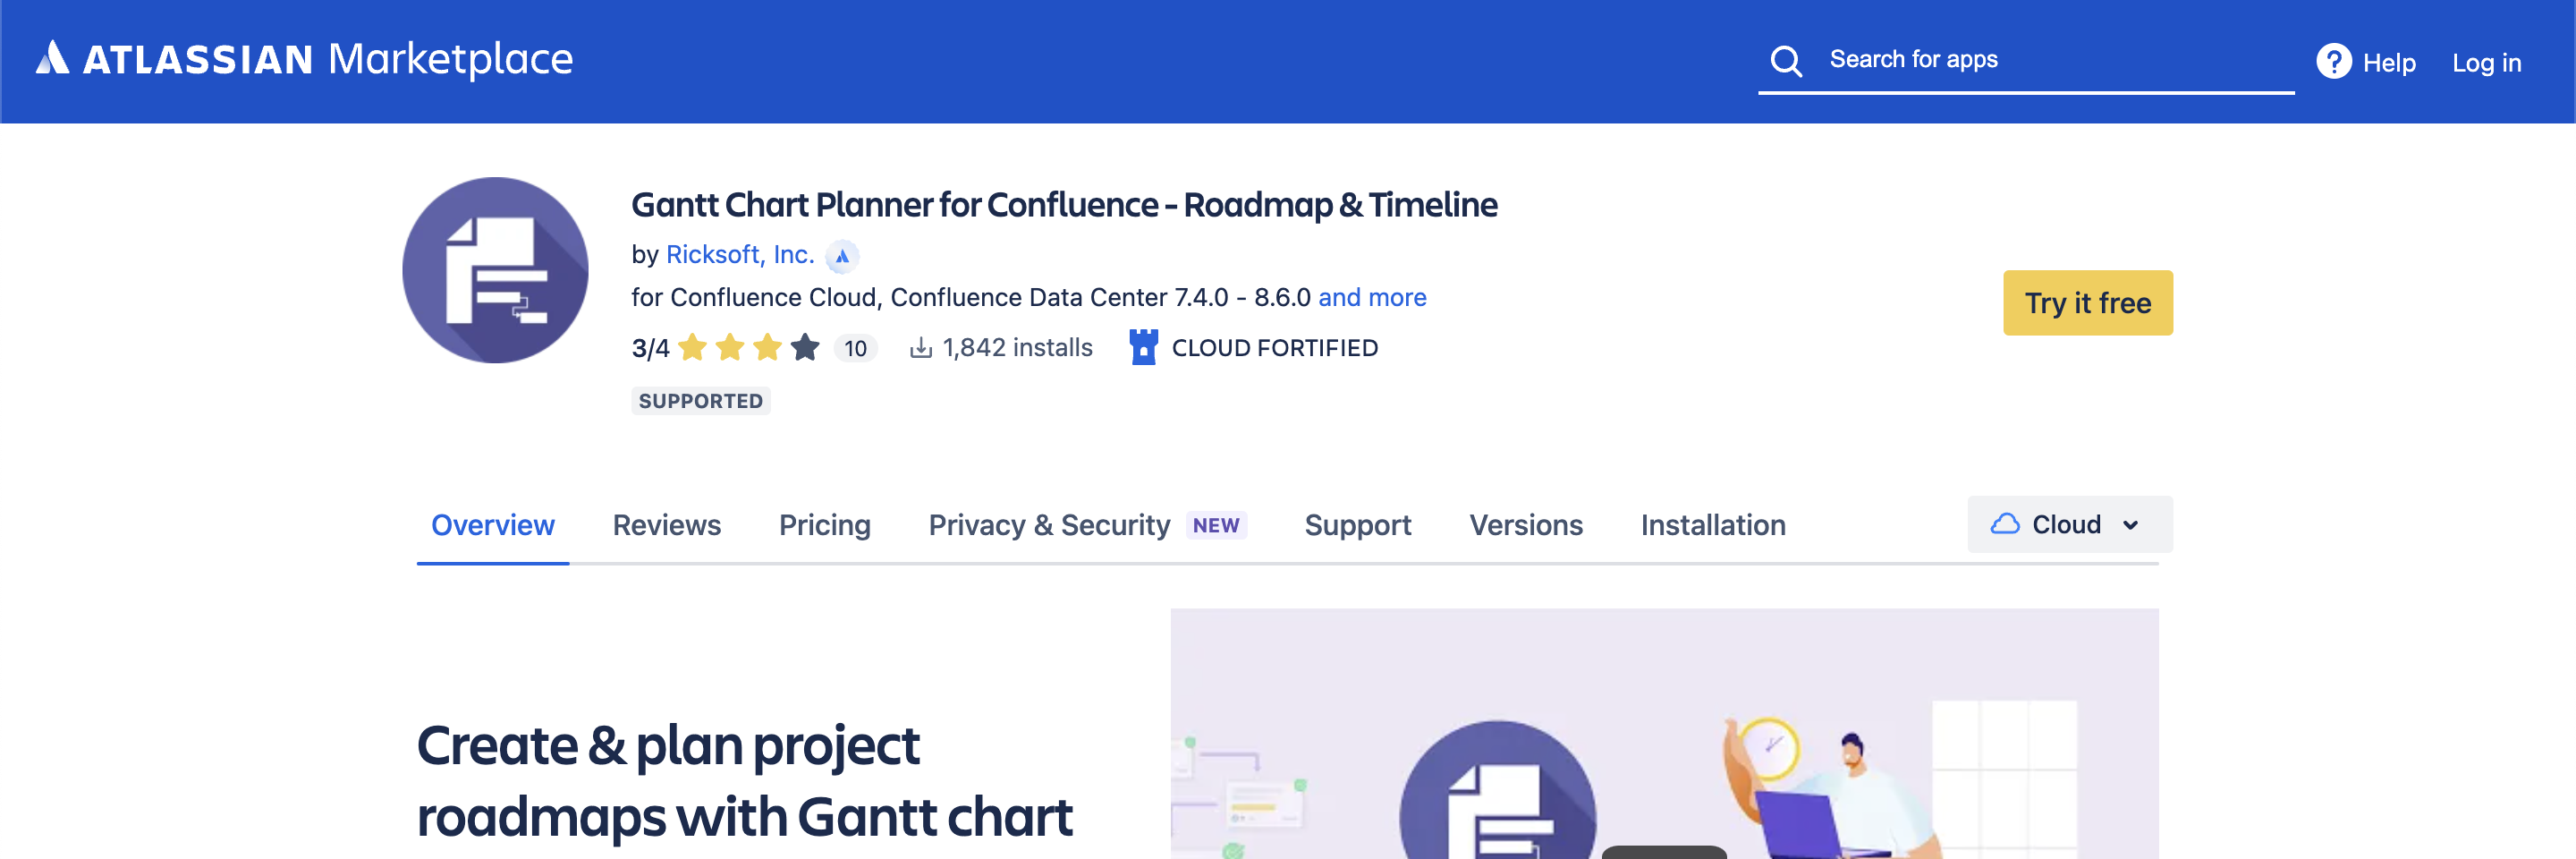
Simply search for Gantt Chart Planner for Confluence on the marketplace or click this link to get our app.
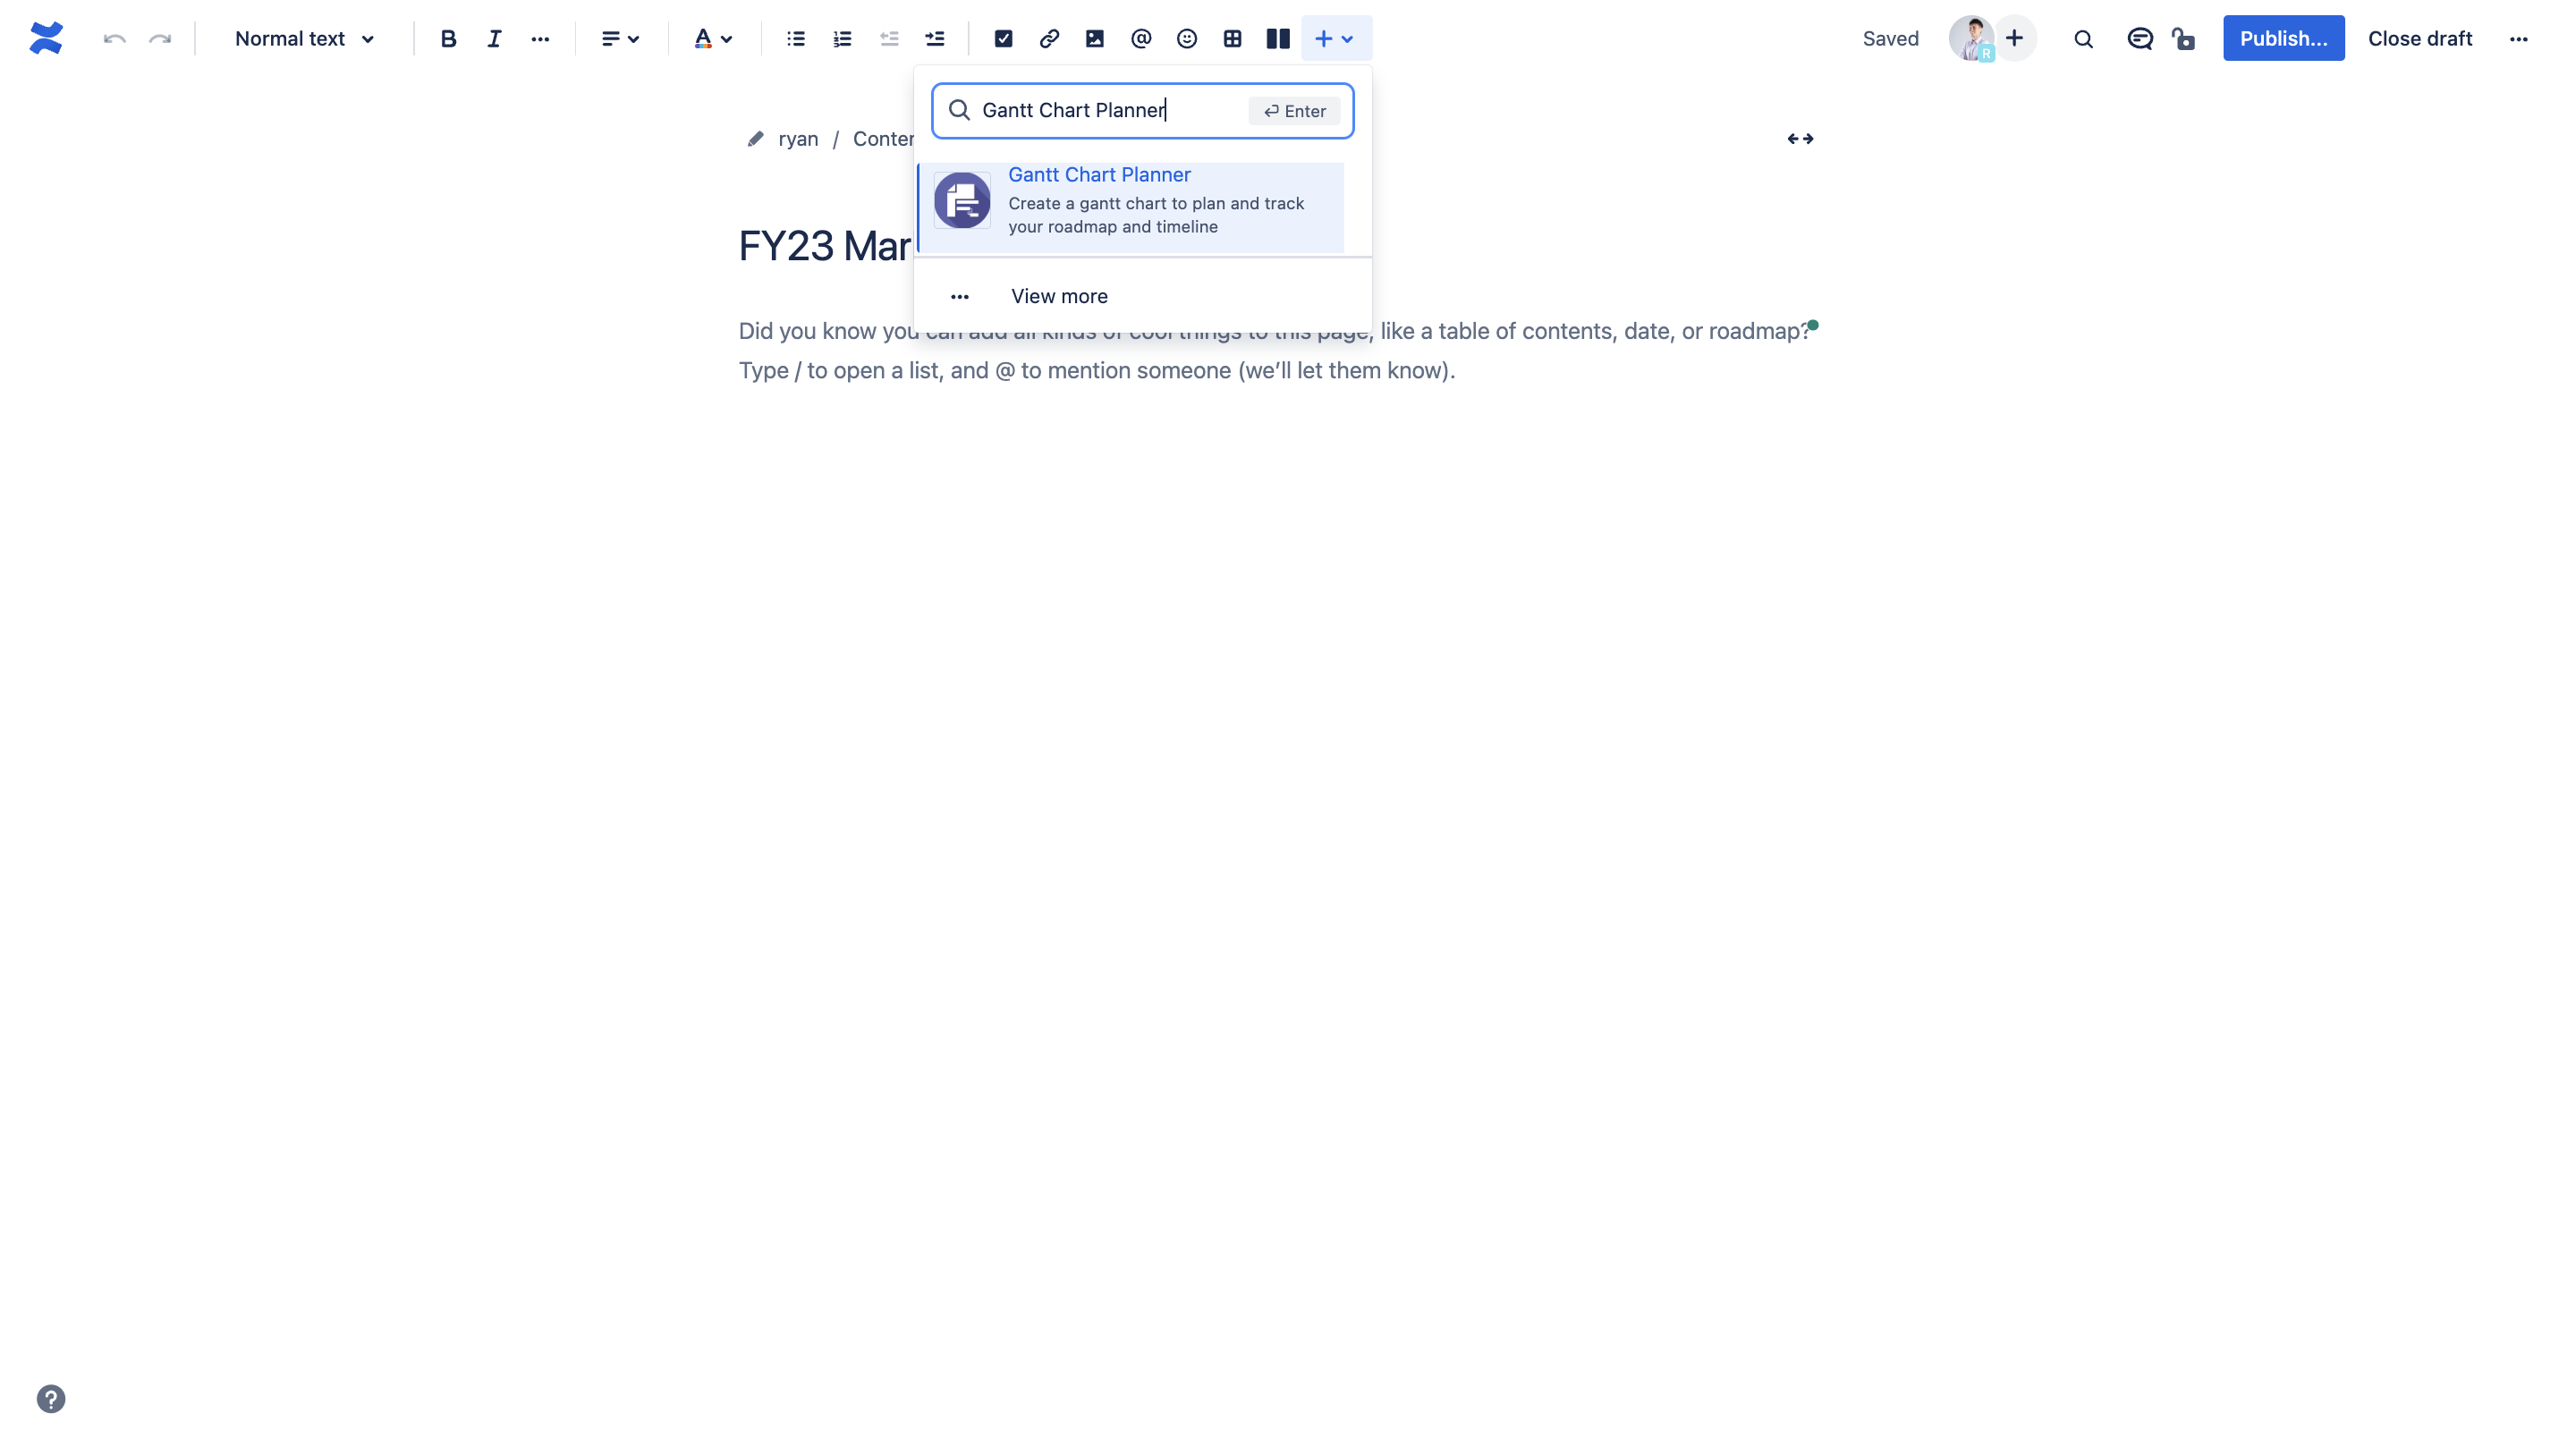
Once you have downloaded the Gantt Chart Planner and integrated it into Confluence, create a new page or edit an existing one. Click ‘Insert’ and search for the Gantt Chart Planner.
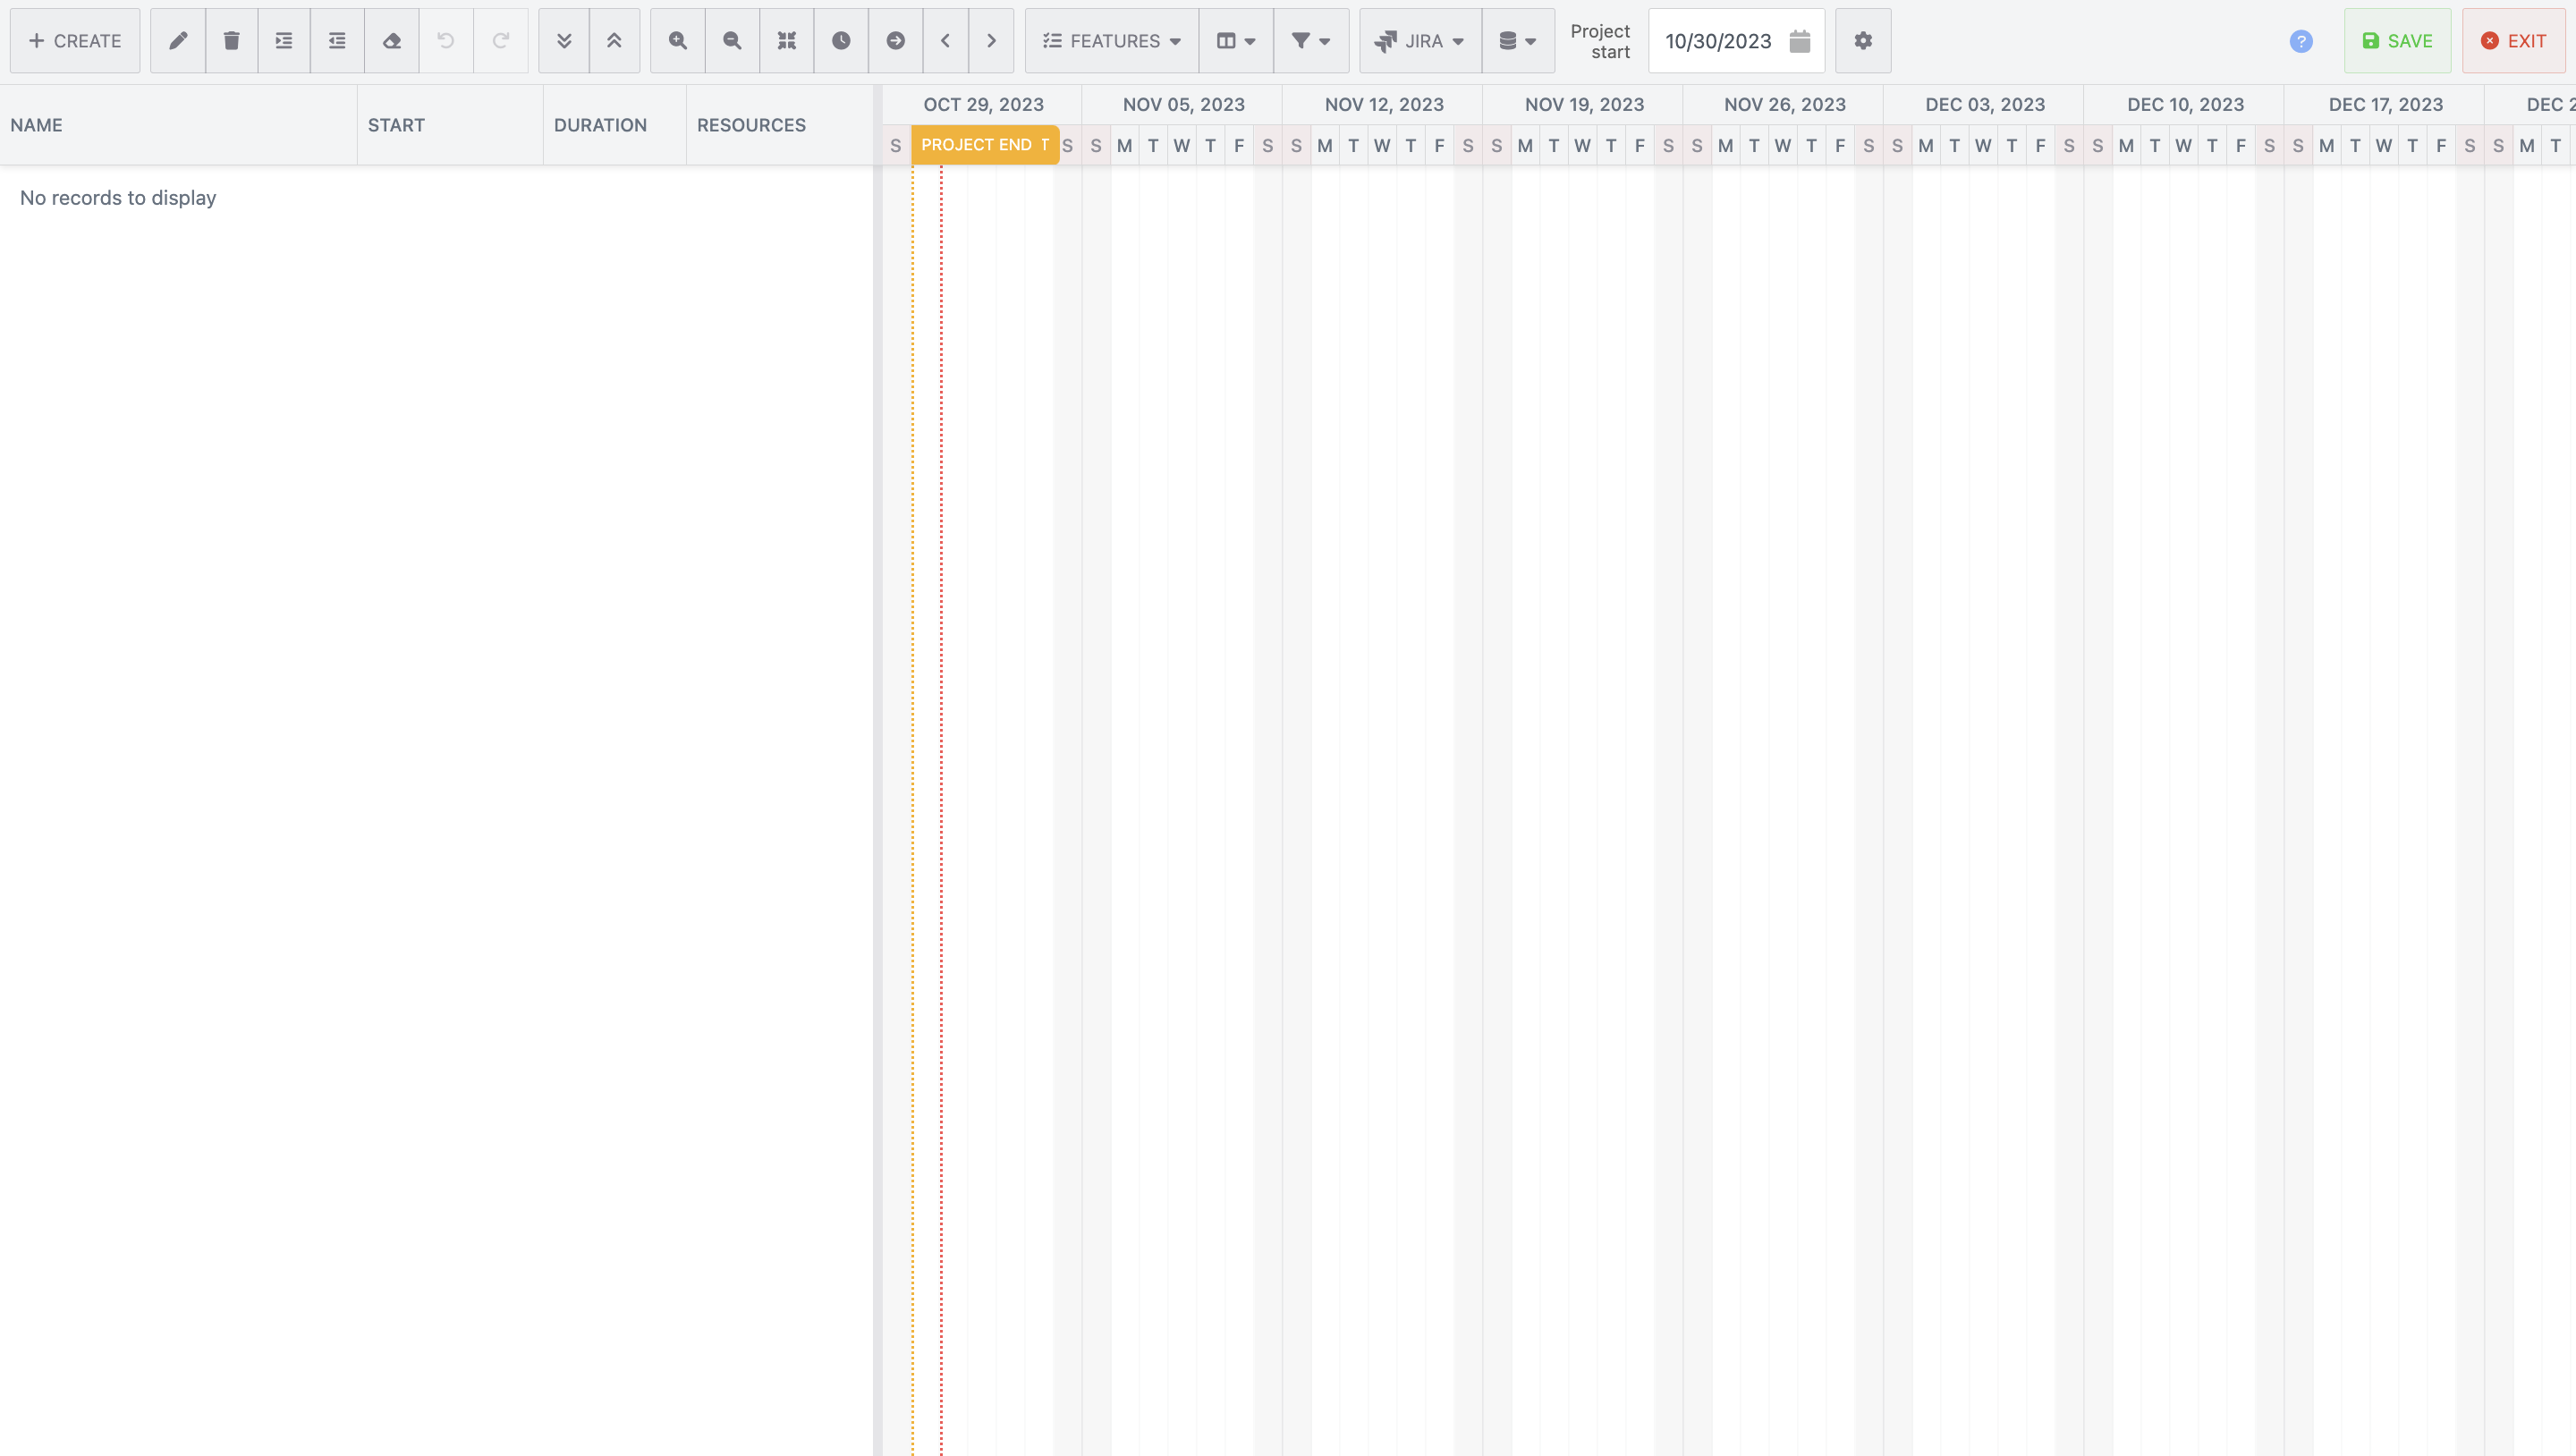
If you’ve followed the previous steps correctly, you should be taken to Gantt Chart Planner’s interface. It should be entirely blank and ready for you to start editing accordingly. Just don’t forget to ‘Save’ after you’re finished.
Congratulations! You’ve just created your very own Gantt chart all within Confluence with just a few easy steps. If you’re still unsure about these steps, feel free to watch our video or consult our extensive documentation.
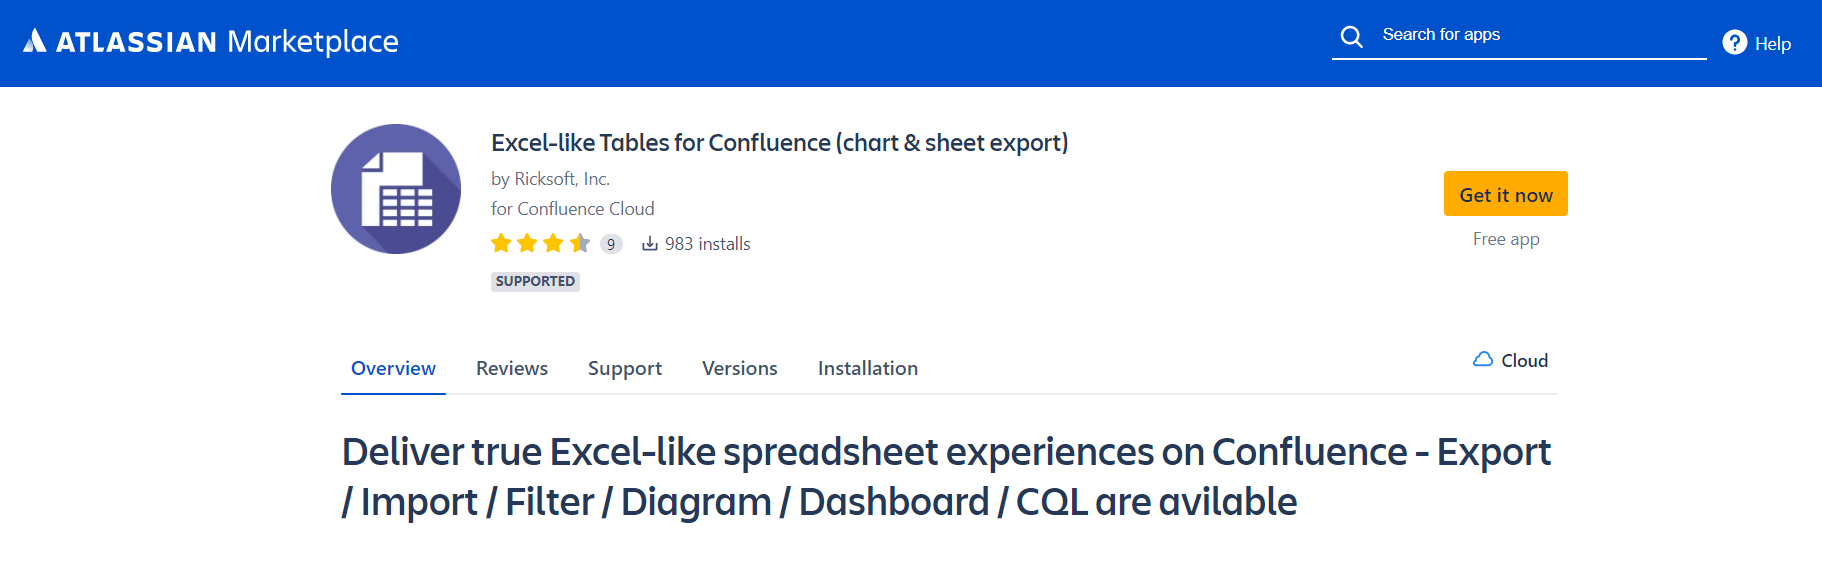
For step one, head over to the Atlassian Marketplace and install Excel-like Tables for Confluence which is entirely free to use.
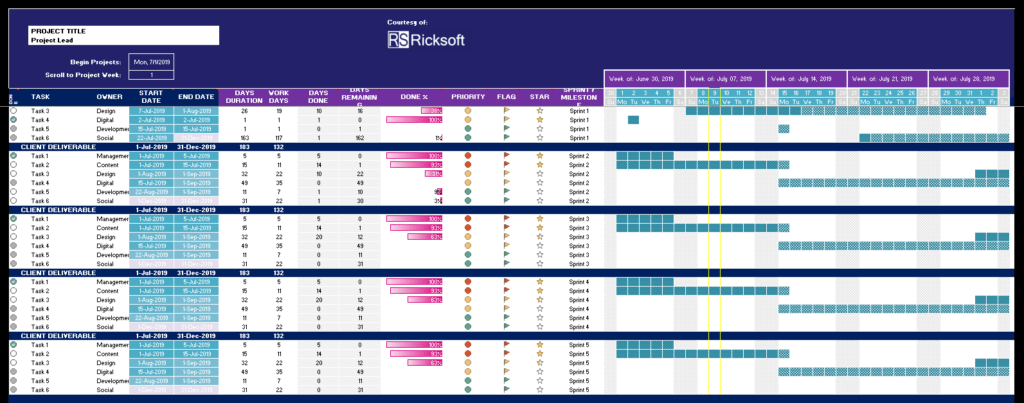
Now that you have the tool to create Gantt charts, you’ll need a template to get started. You could technically start from scratch, but why reinvent the wheel when you can just build on what already exists?
We’ve prepared a template specifically designed for project managers, which you can download here.
Once you’ve downloaded both the template and the add-on, you’re ready to go. Simply create a Confluence page and upload the template to Excel-like Tables.
You can do this as per the following steps:
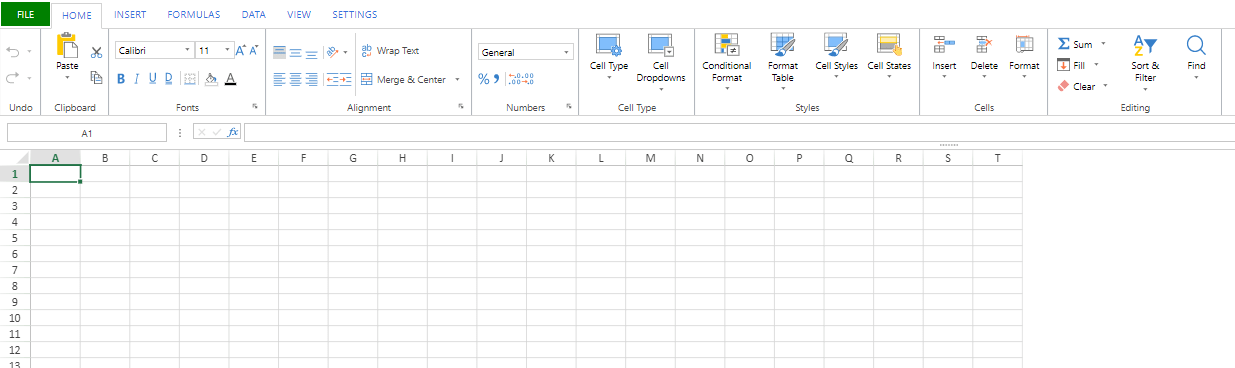
First, create a Confluence page and open Excel-like Tables. Next, click on the ‘File’ button as shown below.
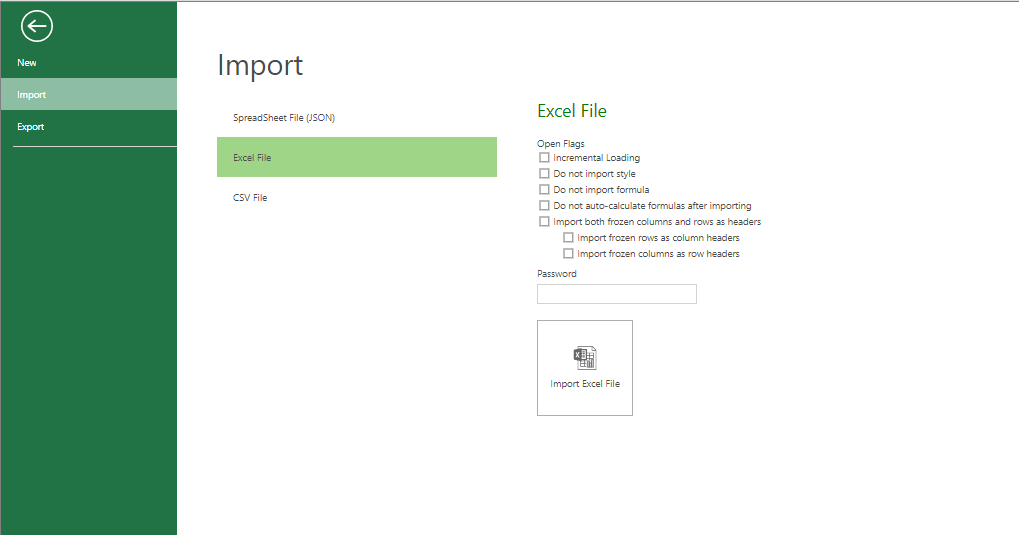
Afterward, press ‘Import’ and select the downloaded template as an Excel file.
Open it, save, and exit the app to return to your Confluence page. You can find these buttons on the top right as in the image below.
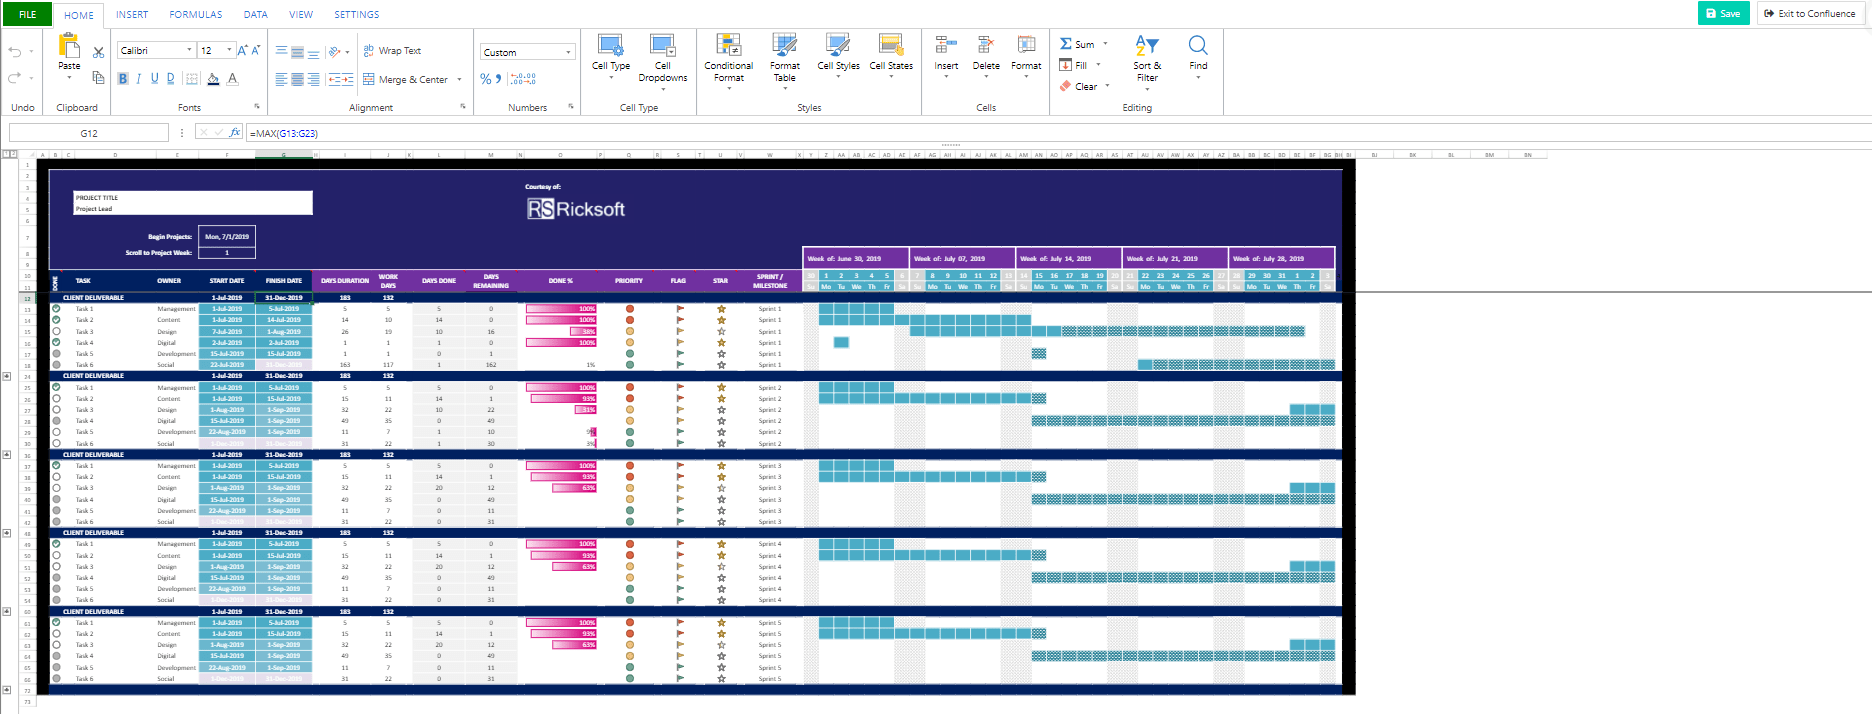
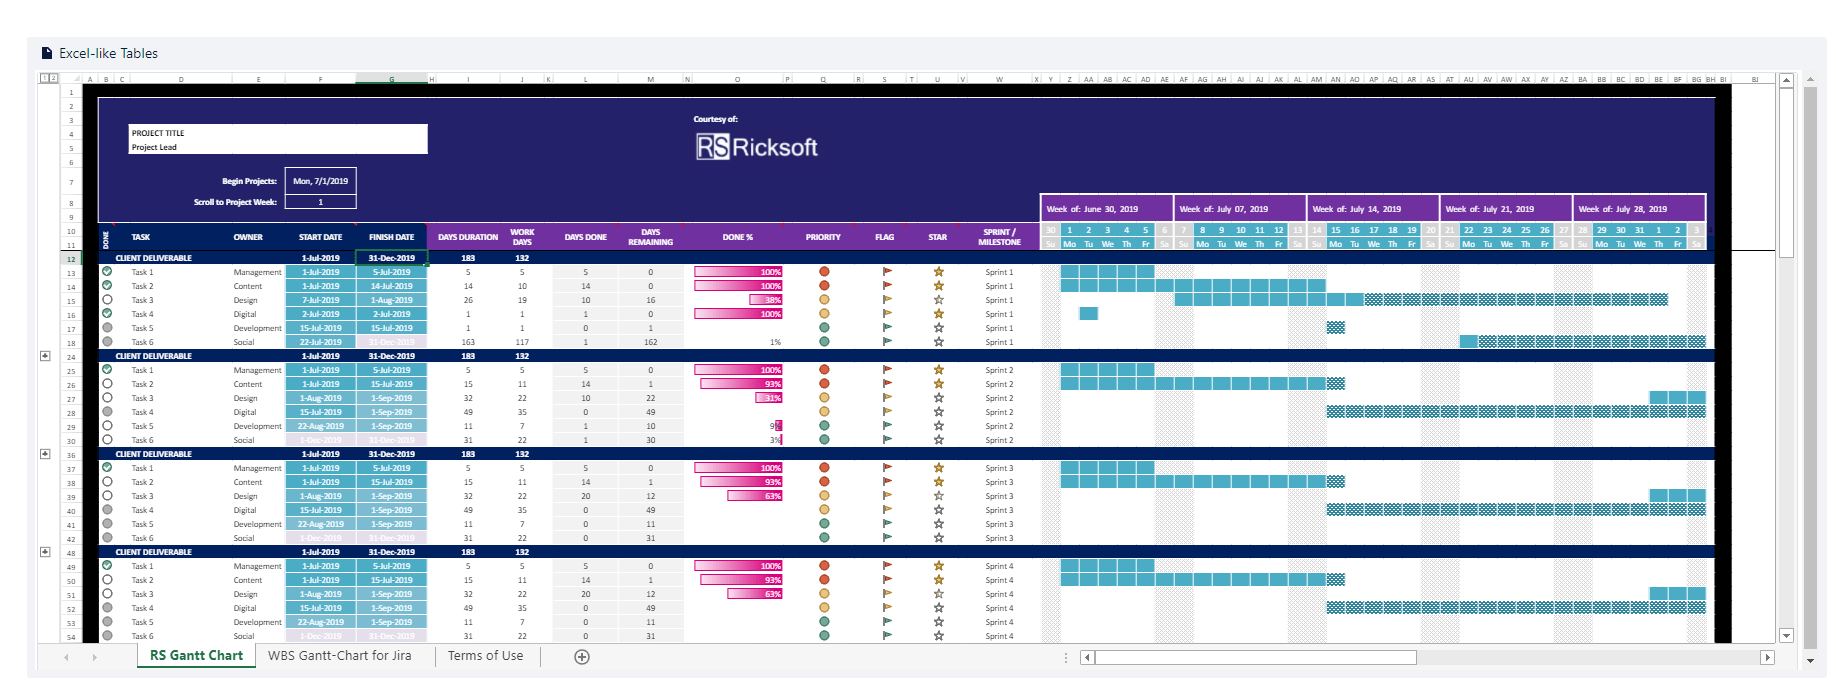
If you’ve successfully gone through all the steps above, your Confluence page should look something like this:
Now that you’ve successfully created your very own Gantt chart in Confluence, you should be all set and ready to hit the ground running. Don’t forget to amend the chart and edit its tasks and dates as per your project!
Gantt charts are fantastic tools but with the power of Excel-like Tables for Confluence, you could do so much more. Learn more about this in our The Power of Excel, Now in Jira, and Confluence e-book!

Now that you know how to create Gantt charts in Confluence, you should start incorporating them into your work as soon as possible. Only with practice and application will you hone your skillset. Beyond Gantt charts though, you can upskill your project management knowledge with our The Power of Excel, Now in Jira and Confluence e-book and guide.
So what’re you waiting for? Download our template and get our add-on today! Alternatively, you can also check out Gantt Chart Planner for Confluence if you’re looking for a dedicated tool that’s designed purely for Gantt charts.