Project Management

Dec 3, 2021 • 7 min read
In This Blog
As a project manager (PM), the success of any project falls on your shoulders. You’ll have to account for factors such as resource management, communication, deadlines, and even budgeting. Within a PM’s toolkit, the Gantt chart may be the most vital when it comes to managing all this. With its ability to simplify complex projects, visualize ongoing work, and account for changes mid-project, not using it is just begging to be left behind.
Likewise, Confluence is also becoming a staple mainstay for PMs, thanks to its potential to keep everyone on the same page by having a shared knowledge base.
Unfortunately, as it comes out-of-box, Confluence doesn’t offer Gantt chart functionalities, which is a shame. In response to this lack, we’ve tested and curated a list of plugins that’ll bring Gantt charts to your Confluence doorstep. Read on to find out more!
As listing every single benefit and method of using Gantt charts would take forever, we’ve listed the most important ones below:
First and foremost, PMs must always keep track of everything going on with their projects. Gantt charts help them do exactly that. Even if you have to keep track of hundreds of factors and team members, Gantt charts aid you with this by providing you with a high-level overview that simplifies complex data into something easy-to-digest. This allows PMs to spend less time frantically trying to keep track of everything and more time on the actual decision-making process.
As Gantt charts lay out the entirety of how a project is progressing in near real-time, everyone will be able to refer to it as a shared source of information. This helps eliminate any confusion or misunderstandings when it comes to individual tasks. Gantt charts also ensure that you will be able to bring up more relevant key points during team meetings related to progress to better frame fruitful discussions.
Gantt charts clearly display ongoing projects, so PMs can see areas in their project that are lagging behind and allocate more resources towards plugging holes, minimizing any delays. Additionally, team members will also be able to see their place in the project along with their colleagues, adding a greater sense of responsibility for everyone involved.
It’s hard to find the best product for your project management needs. We’ve tested and reviewed some of the most popular options out there so read on and take your pick!
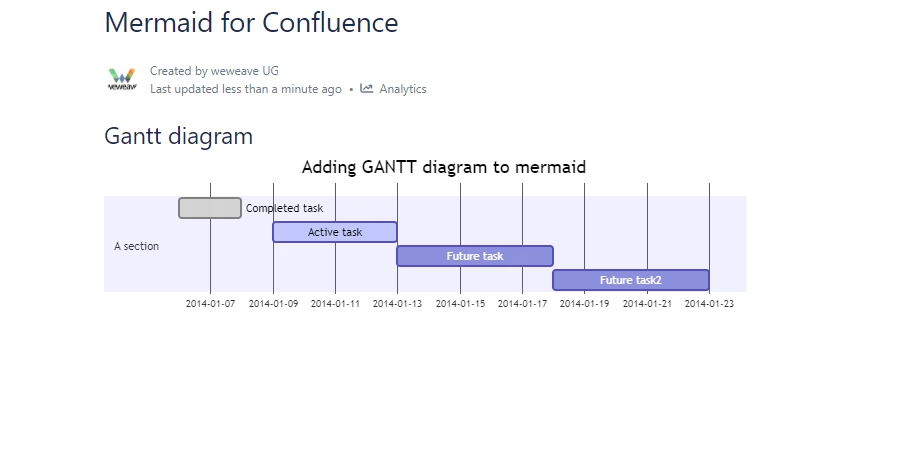
Mermaid Charts & Diagrams for Confluence delivers an easy-to-use interface that produces clean, pretty Gantt charts for Confluence spaces. It also provides live editing functionalities with minimal delays. This means that a preview of your chart can be rendered almost instantaneously while on the go. And it’s simple to use. Rather than fiddling around with buttons and sliders, with Mermaid Charts, you create charts and diagrams by using textual descriptions through a provided macro.
That said, its greatest strength may be its weakness. The product, though solid, is quite basic and doesn’t offer more in-depth functionalities you’d find in alternatives like Excel-like Tables for Confluence. Still, with prices starting at $1/month for a team of 10 users, we think it is a fantastic gateway plugin for PMs.
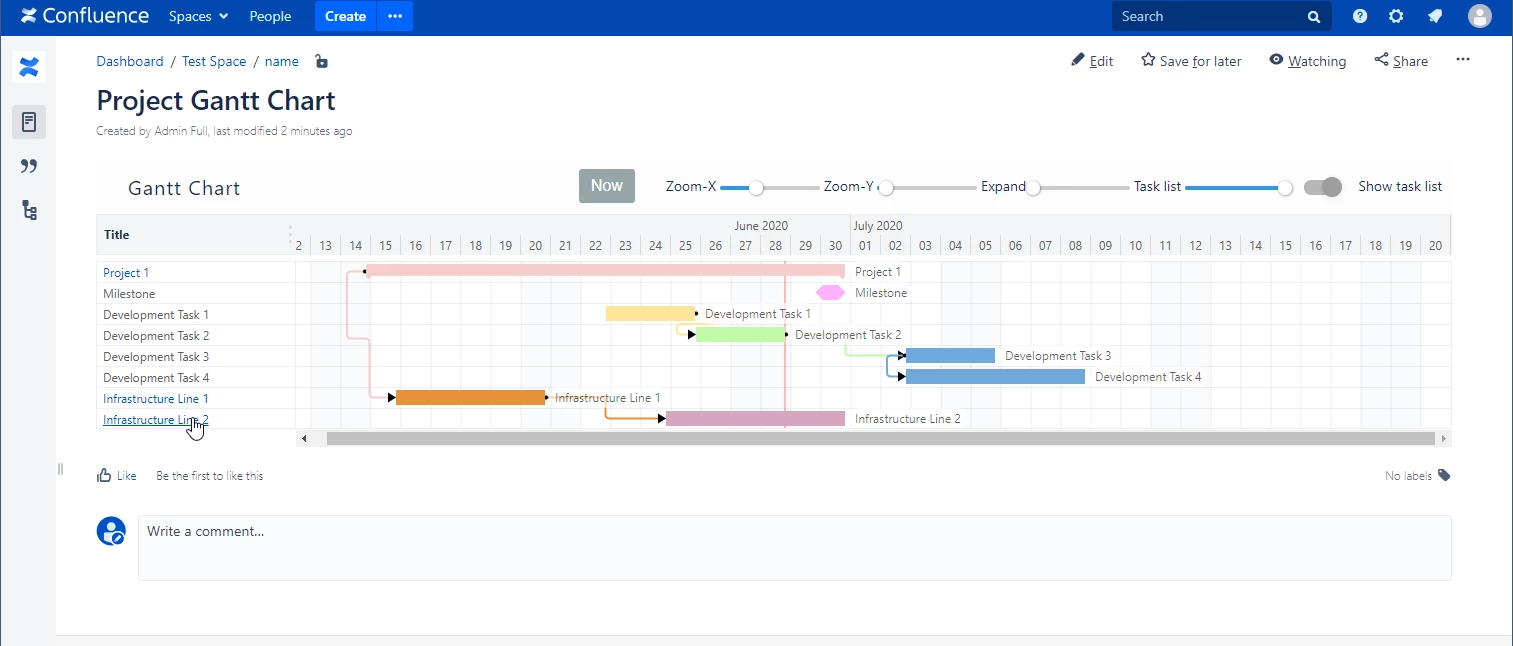
Gantt charts and Confluence aren’t the easiest to use or understand at times so why further burden yourself with something complicated when simpler alternatives exist? Enter: Easy Gantt Charts for Confluence. With this plugin, creating Gantt charts with Confluence table data is as simple as playing around with the Confluence editor. Alternatively, you can even use its in-built Gantt chart macro. Either way, you’ll be able to freely edit your charts, set time scales, and configure task dependencies with ease.
It isn’t perfect though. We’ve noticed issues when it comes to rendering, and when viewing your Gantt charts, you’ll notice a lack of a horizontal scroll option. Still, it’s well-priced; starting at $5/month per 10 users.
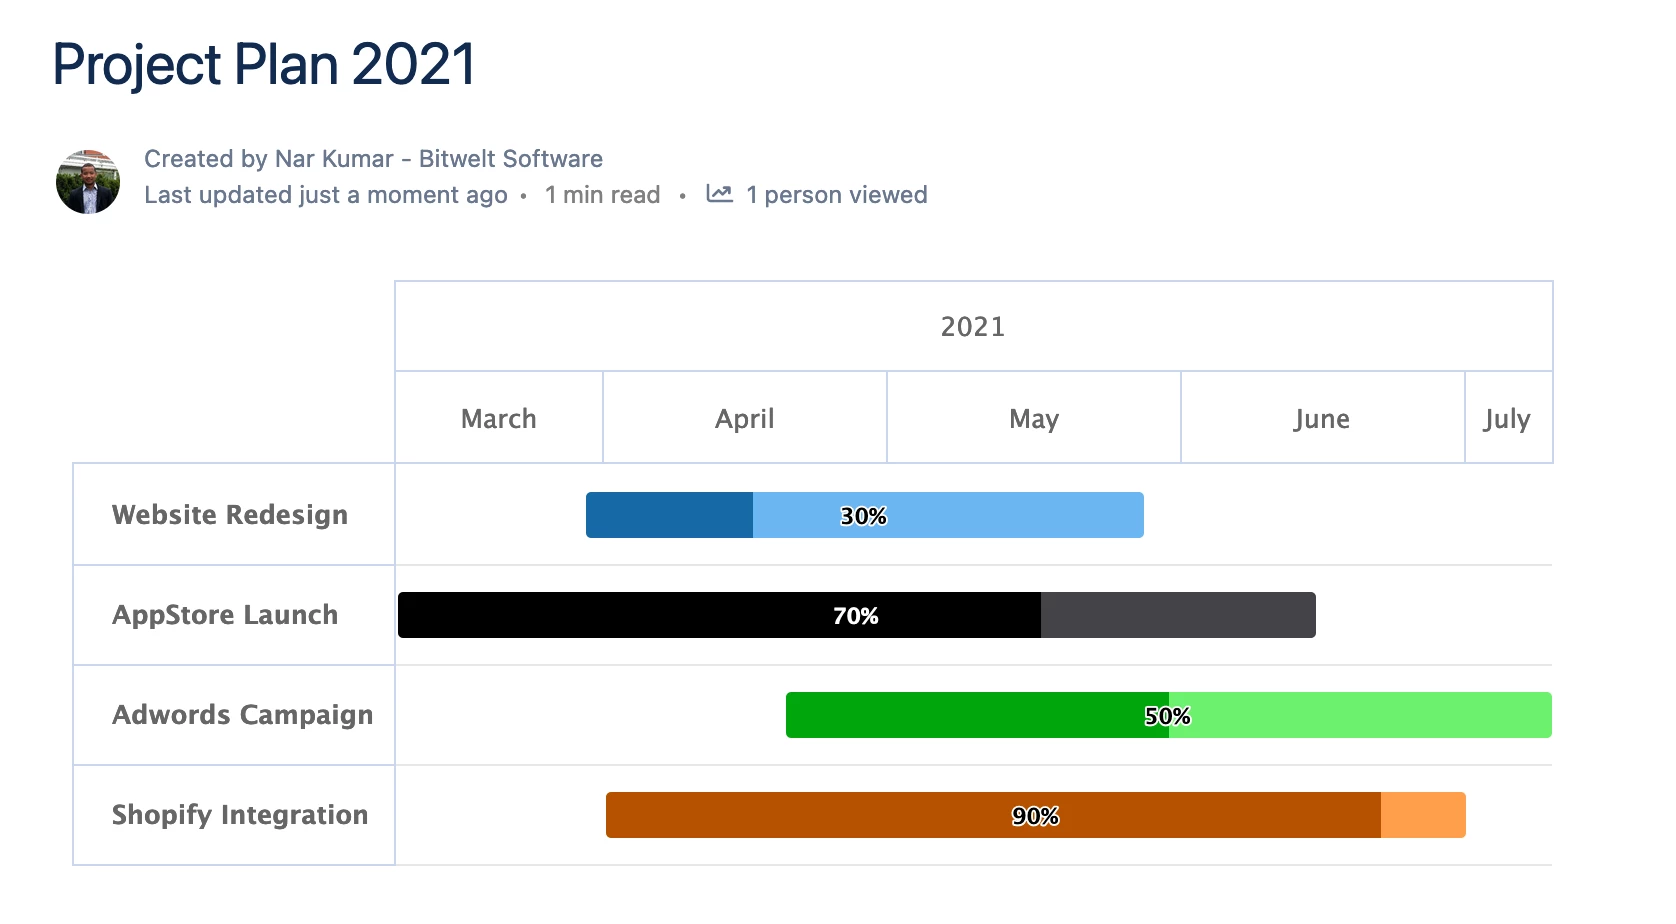
This simple yet unassuming macro delivers more than meets the eye if given the opportunity to shine. The Gantt Chart Macro is designed for one thing–adding Gantt charts to your Confluence pages–and it sure does its job well. With the macro, you’ll be able to play around with everything Gantt charts offer from tasks (projects, milestones, tasks) to creating dependencies between tasks. You can even add a little individual flair with its color palettes or make your own color schemes if nothing suits your taste.
Its biggest fault is its lack of flexibility for PMs looking for a more advanced plugin. However, if you’re seeking something you can use almost immediately, look no further. And did we mention that the macro is free-to-use?
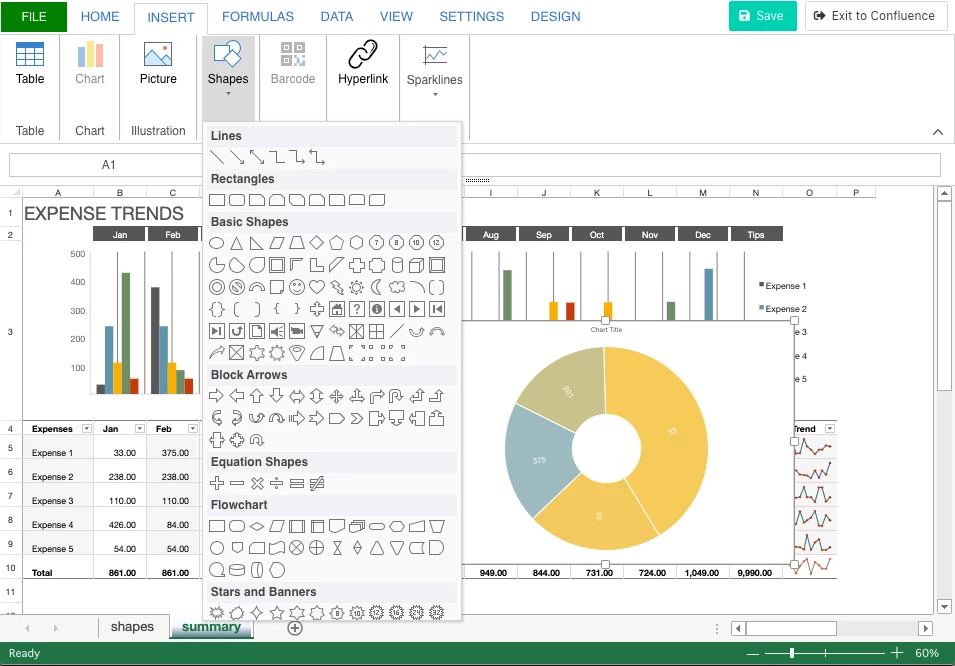
If you’re a PM looking for a powerful product that can do much more than simply adding Gantt charts to Confluence, we’d suggest considering Excel-like Tables for Confluence. You’ll be able to create detailed Gantt charts that can accommodate even the most complex and lengthy projects, but that’s only the icing on top. Look deeper and you’ll discover that its host of features enables PMs to do so much more, thanks to its Excel-like capabilities that let you create tables, charts, shapes, and formulas, to name a few. You can even generate other types of graphs like scatter plots and pie charts to complement your projects. You’ll also find that it’s equipped with full Confluence integration for CQL Searching.
The only con is that it might be a little overkill for PMs looking for something straightforward. So, if you’re looking for a product that’s a little more specialized in terms of Gantt charts, you should also consider trying Gantt Chart Planner for Confluence.
But if you’re willing to roll up your sleeves to learn how to take full advantage of Excel-like Tables for Confluence, then the sky’s the limit.
While Gantt charts are an excellent tool for PMs, it isn’t enough to guarantee project success. Learn how you can identify blockers, eliminate risks, and ensure everything stays on track in our free e-book below!

Finding the best Gantt chart plugin for your project needs can be a tricky task, requiring both trial and error before you find your match. Some products may have too few features, while others may be too overwhelming. But in our opinion, it’s always better to have a little too much of something than to be left wanting more.
Why not try Excel-like Tables for Confluence as the first step in your search to see the kind of capabilities you can gain? Or explore Gantt Chart Planner for Confluence if you prefer to harness the power of Gantt charts alone.