Project management isn’t easy. You have to manage multiple teams, limited budgets and resources, and a dizzying array of tasks to ensure that all the little details come together to complete the big picture. It’s no wonder that most organizations have a 70% project failure rate.
One of the most preventable reasons for project failure is the lack of a project plan. As Benjamin Franklin once said, “By failing to prepare, you are preparing to fail.” Yet, a surprising number of project managers do just this. They jump right into execution without first developing a complete project plan.
In this blog post, we show you how to develop your project plan and visualize it using Gantt charts. With this approach, you don’t just have a plan for success. You have a way to see critical dependencies, easily manage resource constraints and timelines, and keep track of it all as your team marches towards success.
New to Gantt charts? Check out our Ultimate Guide to Jira Gantt Charts for everything you need to know about using Gantt charts for Jira project management.
How to Create a Project Plan in Jira?
Step 1: Understand What Needs to Be Done
Your first major task is to capture all the work that needs to be completed. Begin by meeting with project sponsors and other stakeholders to discuss their goals and expectations. Once you understand these requirements, you’ll be able to develop a detailed project scope, budget, and schedule to ensure that everyone is on the same page. This will save you and your team from numerous headaches later on by providing a shared vision for success.
Step 2: Define the Project Deliverables
What are the expected outputs of this project? A project plan, requirements definition, software, test results, et cetera—you’ll likely have multiple deliverables spread across the project timeline. Identify all the deliverables of the project and “guesstimate” when they’ll be due. This rough timeline will help us as we develop our project schedule later.
Step 3: Break the Deliverables Down into Tasks
Now that you have identified the major components of the project, break them down into individual tasks. Here, we use what is called a work breakdown structure (WBS). A WBS breaks the deliverables down into subdeliverables, and then it decomposes subdeliverables into tasks that can be assigned to a single person.
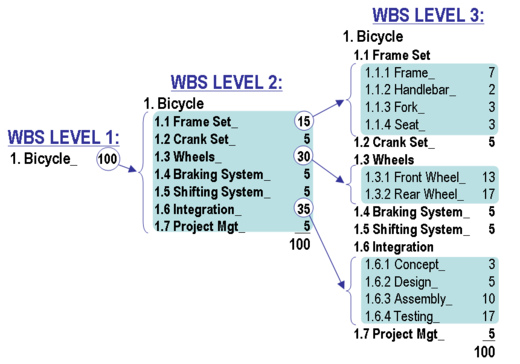
A work breakdown structure enables you to identify any areas of the project that are poorly defined. These “grey areas” can represent hidden risks to your project schedule. Identifying them up front can help you avoid potential delays and budget overruns. The WBS also helps you identify dependencies—that is tasks that cannot be started or completed until another task has been started or completed.
Step 4: Create the Project Schedule
If you are using software like Atlassian Jira for project planning, you can now enter your tasks into the system and begin assigning them to resources. You (or your team) should provide time or point estimates for each task to assist with resource and project planning.
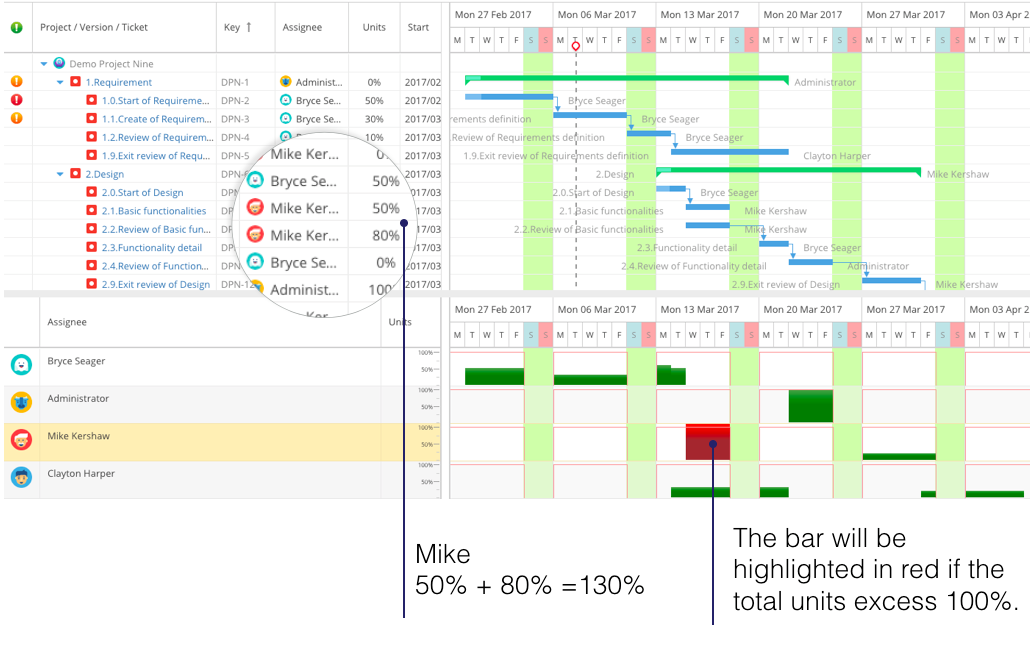
As a project manager, you’ll want to keep an eye on your resource utilization (i.e., how much work each individual is assigned at any given time). This is where an app like WBS Gantt-Chart for Jira comes in handy. WBS Gantt-Chart’s Resource View helps you visualize your resource allocations in a simple bar chart. If a team member’s workload gets too high, then their chart is highlighted in red, so you can reallocate tasks to finish your project on schedule.
One of the biggest risks to project plans is dependencies. These are tasks that are dependent upon other tasks. For example, with a software development project, you cannot begin testing until the code has been developed. As a PMP, you’ll want to identify these dependencies at the outset of the project. This will help you prioritize tasks, and it will allow your software developers (for example) to understand the impact of their work on other teams.
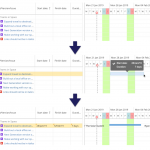
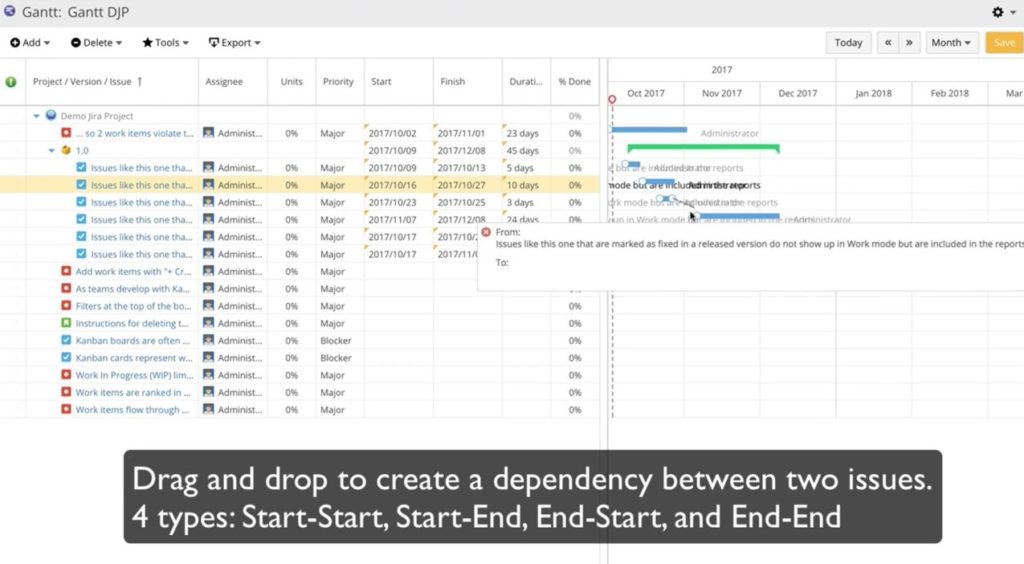
This is where Gantt charts really shine. With an app like WBS Gantt-Chart, you’re able to create dependencies with just a couple of mouse clicks. Now, everyone can see critical task relationships. And if a task is ahead or behind schedule, the Gantt chart can automatically adjust subsequent tasks to reflect the latest state of your project plan.
Keeping Your Project on Schedule
Starting with a clear plan is the first, essential step to project management success. By following the project planning steps above, you’ll avoid many of the hidden risks that threaten to derail your project, and ensure that your stakeholders and teams have a shared vision for success. But, as the poet Robert Burns noted, “The best laid plans of mice and men often go awry.” The best PMPs understand the haphazard nature of project planning and are prepared to adjust on the fly. Tools like Gantt charts help by providing an easy way to visualize project plans, dependencies, and your success.