Project Management

Jan 10, 2024 • 4 min read
In This Blog
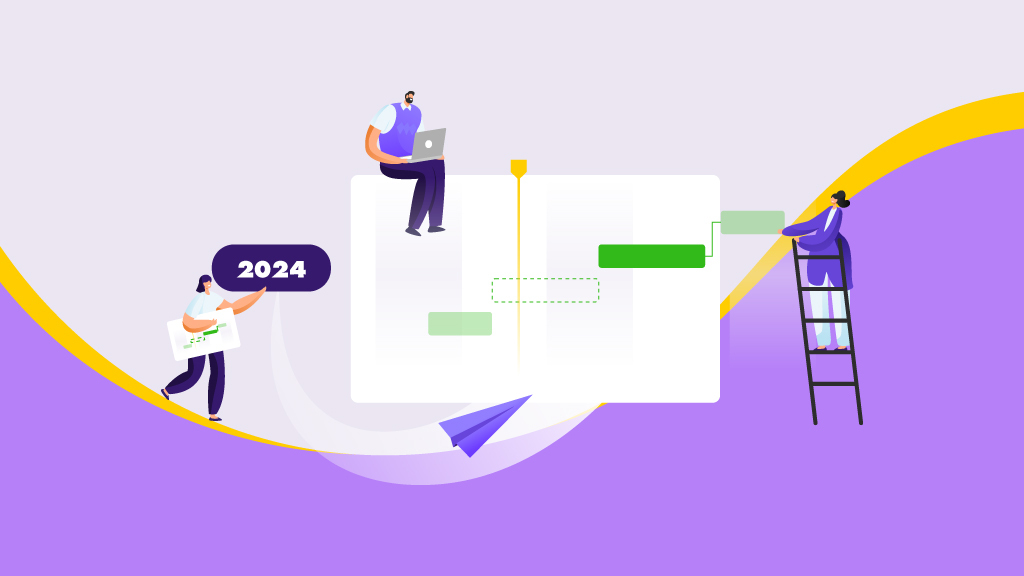
The new year looms, and with it comes more exciting yet challenging projects. From agile software development to portfolio management, we’re here to help you navigate your way to success in the ever-evolving project management landscape.
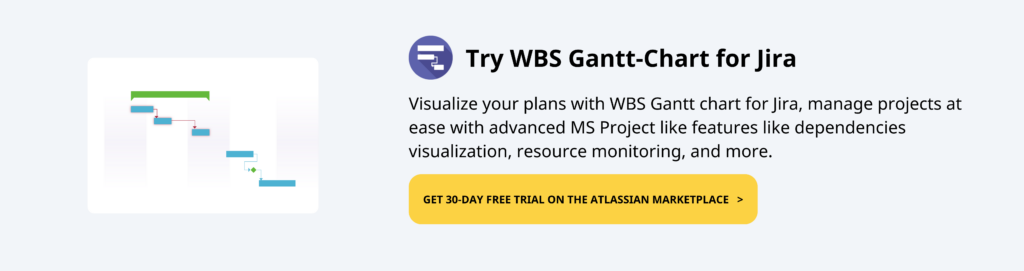
To ensure WBS Gantt-Chart for Jira is fully equipped to support your ambitious goals, we focus on building functionalities that address real-world challenges. Here’s a recap of the top requested features introduced in 2023, thanks to your invaluable feedback.
Efficient project management hinges on the ability to track progress and monitor key milestones. With these WBS Gantt-Chart enhancements, keeping tabs on your project’s journey is more intuitive than ever.
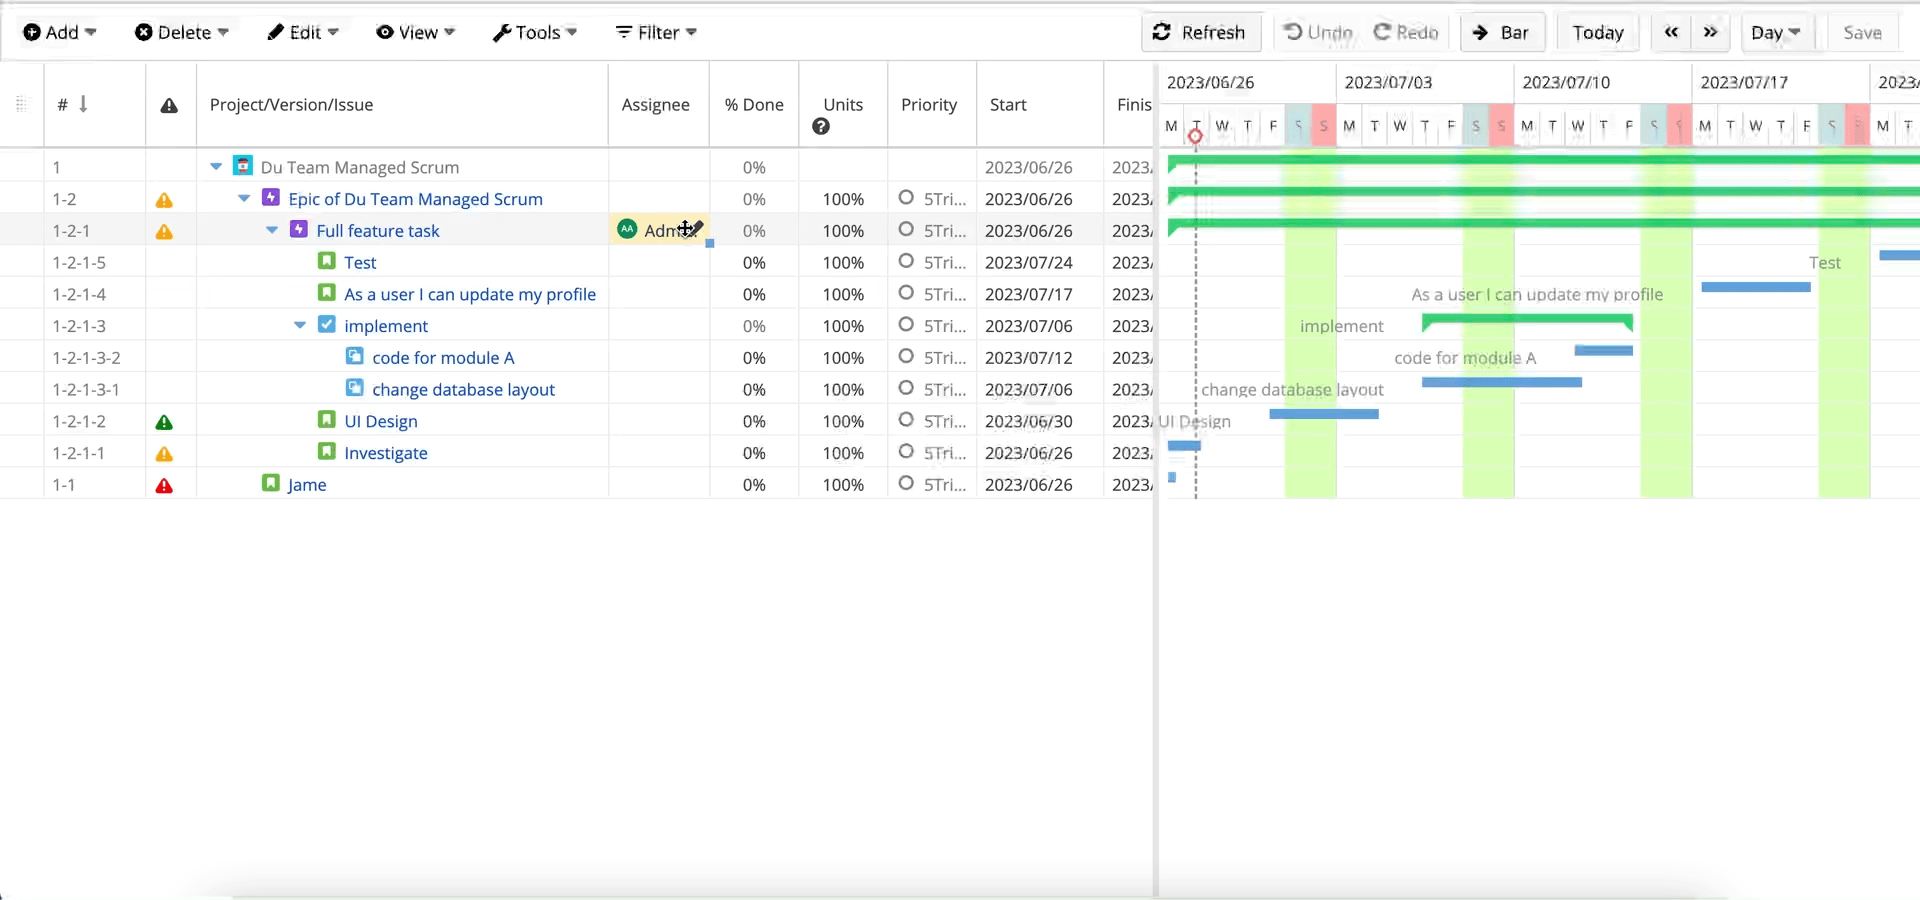
Visualizing milestones just got a whole lot easier. The addition of a milestone progress line allows you to see at a glance how each milestone is advancing or whether it’s behind schedule, so you can always stay on top of crucial project events.
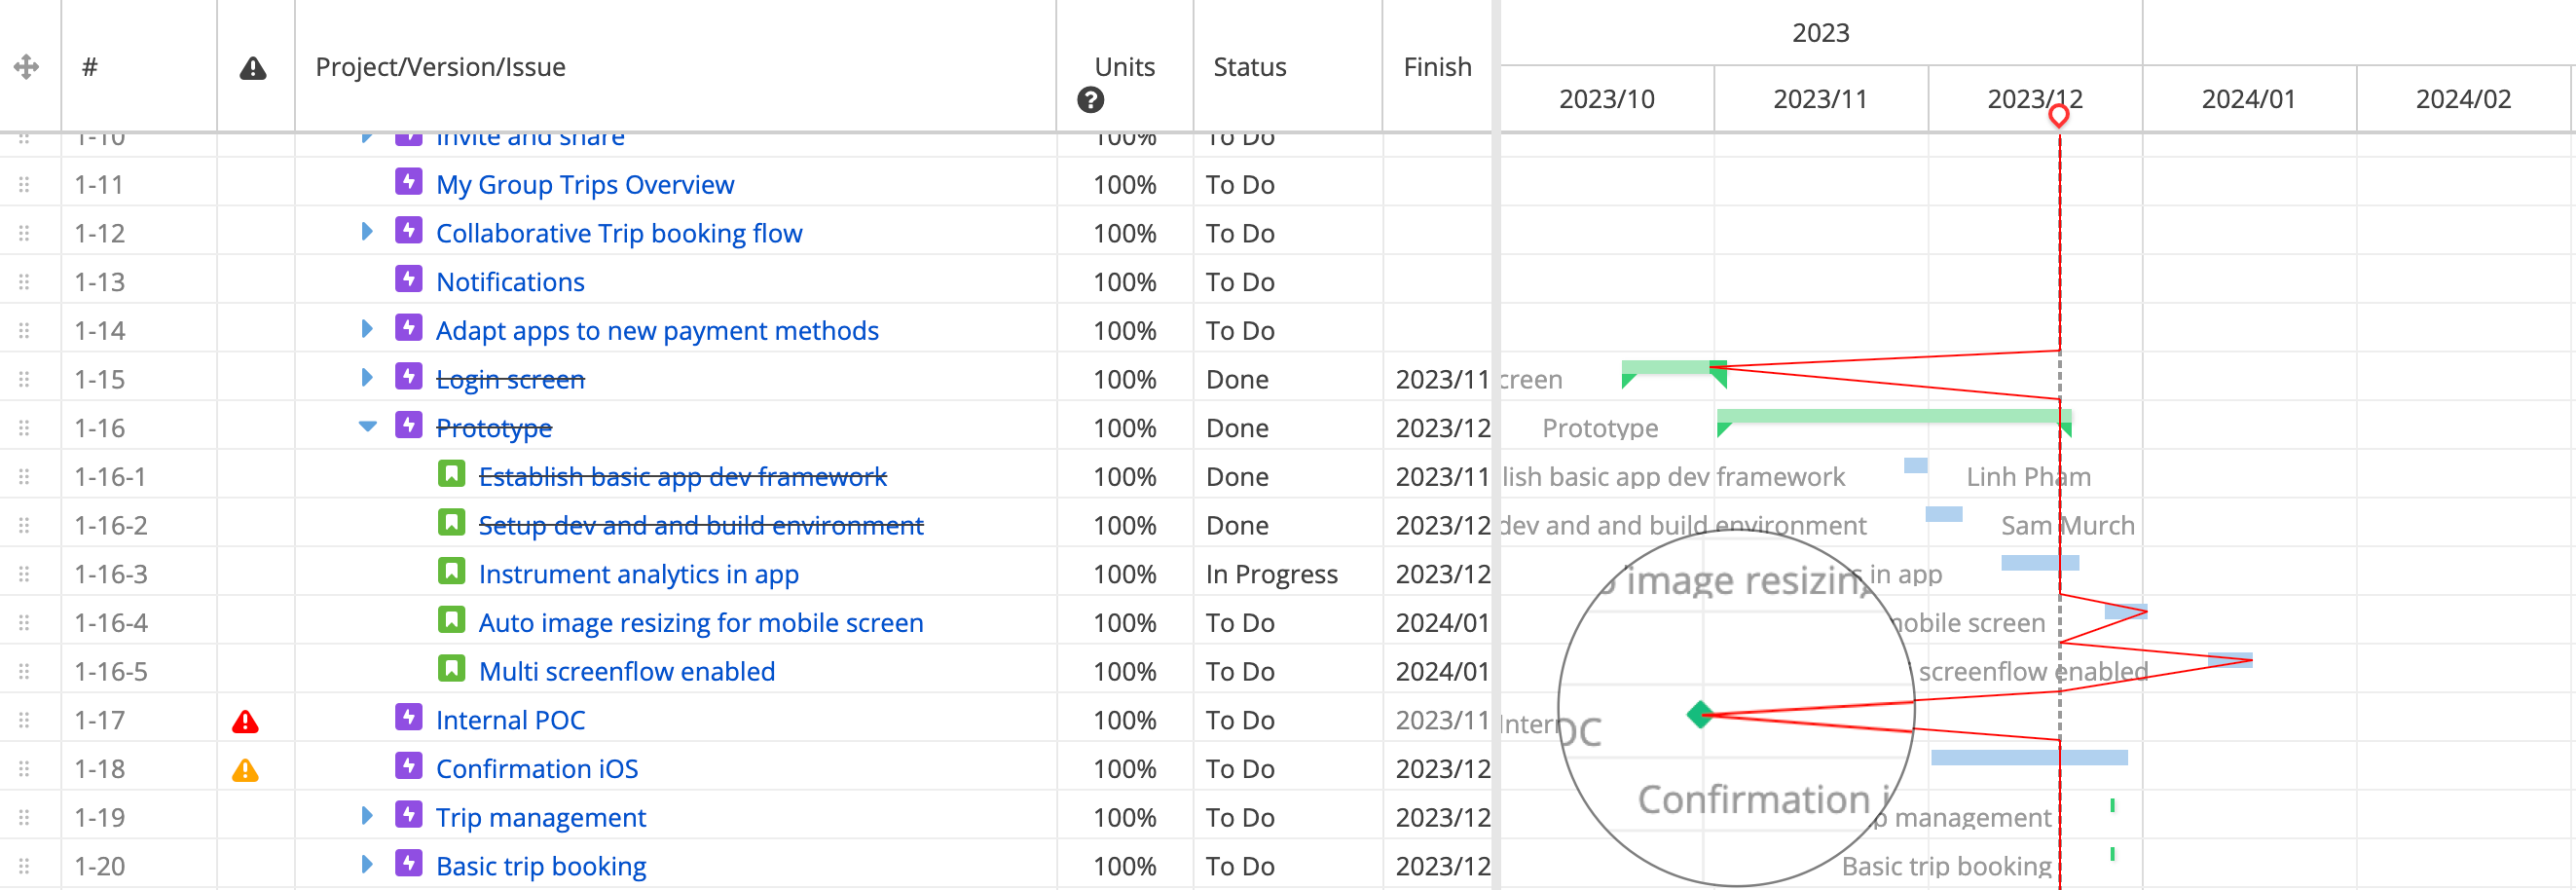
Accurate project tracking requires precise result updates from team members. Once an issue is completed (resolved), the % Done will be set to 100%. As a result, you don’t need to update progress fields separately; you’ll always have a real-time overview of your project’s progress.
You can easily switch between the full screen of the issue tree and Gantt chart, depending on the requirements. 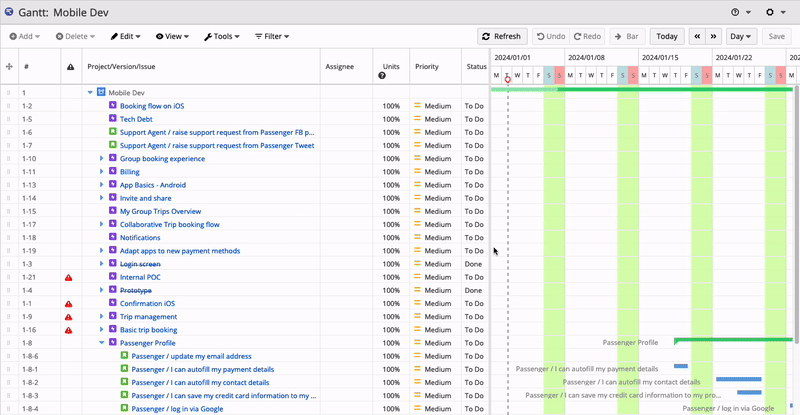
The power of Gantt charts is now at your fingertips for every type of project and team in Jira Cloud. WBS Gantt-Chart app is now compatible with more project types, including Jira Service Management and Work Management projects. Your team can transform their work into Gantt charts seamlessly for more versatile use cases:
Whether you’re managing IT services or customer support projects, WBS Gantt-Chart lets you visualize tickets in a more dynamic view, especially to map related bug reports and corresponding tickets from development boards. You can also quickly generate the Gantt chart view directly from the project side panel and gauge the complete timeline of your queue. 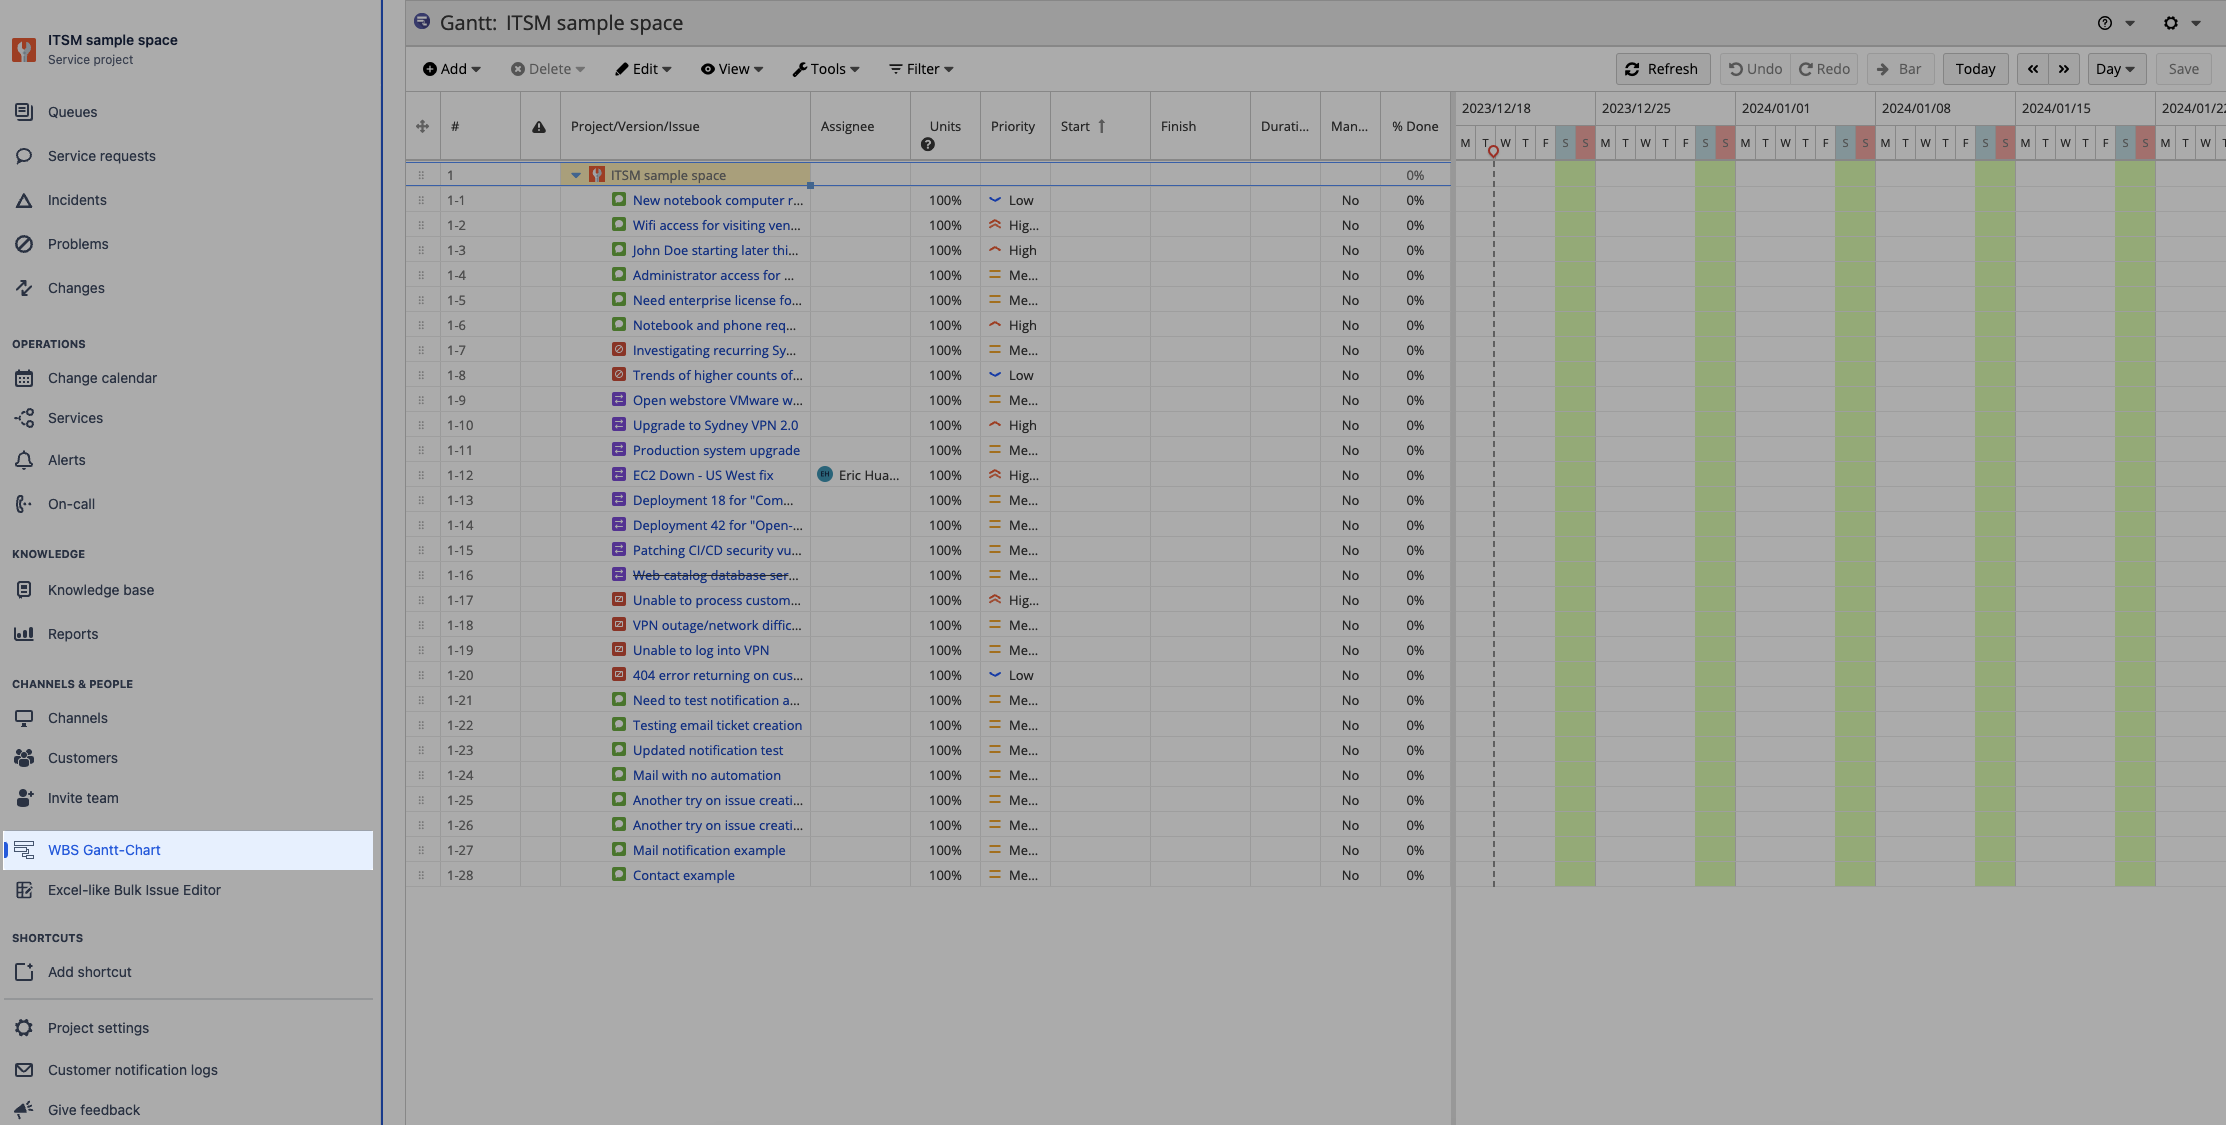
The Work Management project type is designed for business teams focused on task management and collaboration, which requires a comprehensive timeline view. With WBS Gantt-Chart support, you can now effortlessly create Gantt charts in Jira for these projects, enhancing visibility and coordination. It’s extremely helpful since the Timeline feature for business projects currently lacks Epic visualization and resource view. 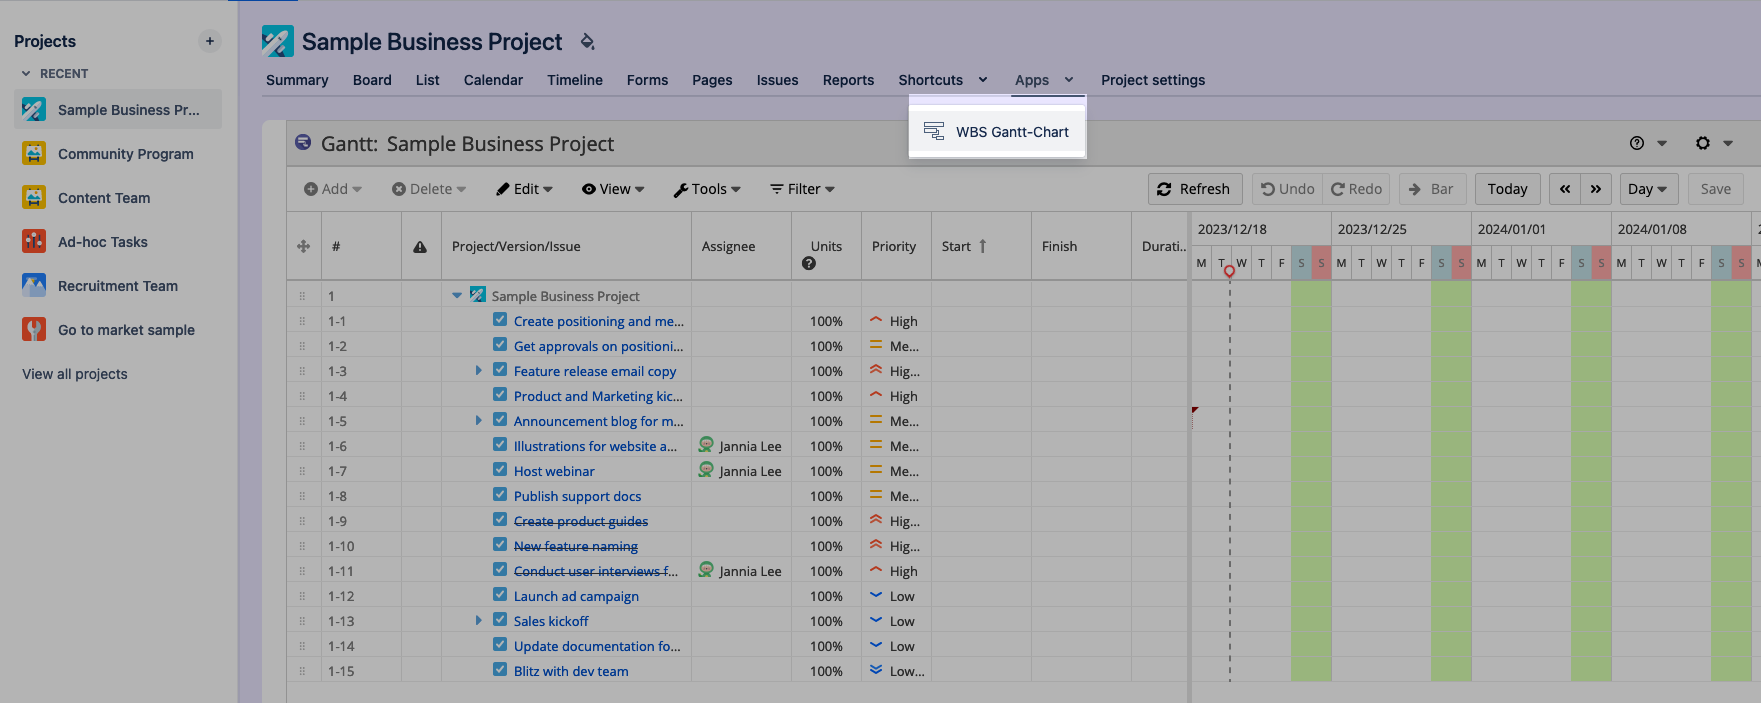
Kick-off new projects in seconds with extended support for template sharing – compatible with both company-managed and team-managed projects. 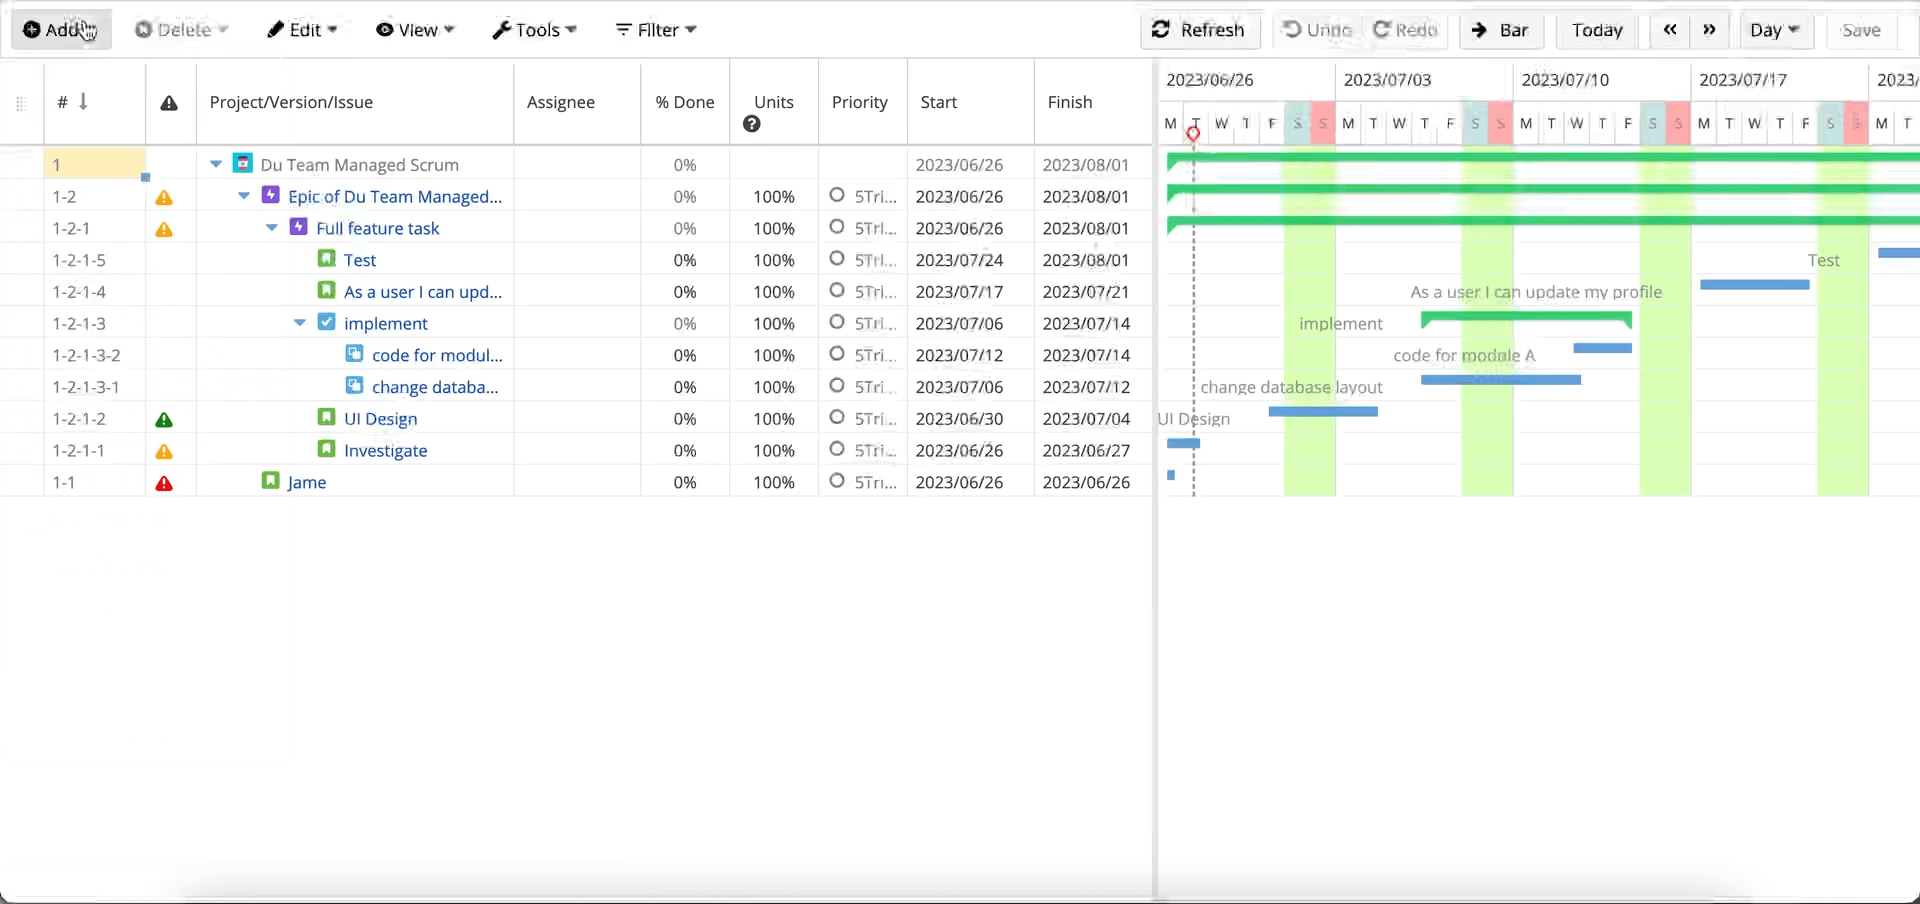
Last but not least, you can now tailor your workspace to your preferences with the introduction of dark mode. Whether you’re burning the midnight oil or simply prefer a sleek, modern interface, the new theme enhances the visual experience while reducing eye strain. 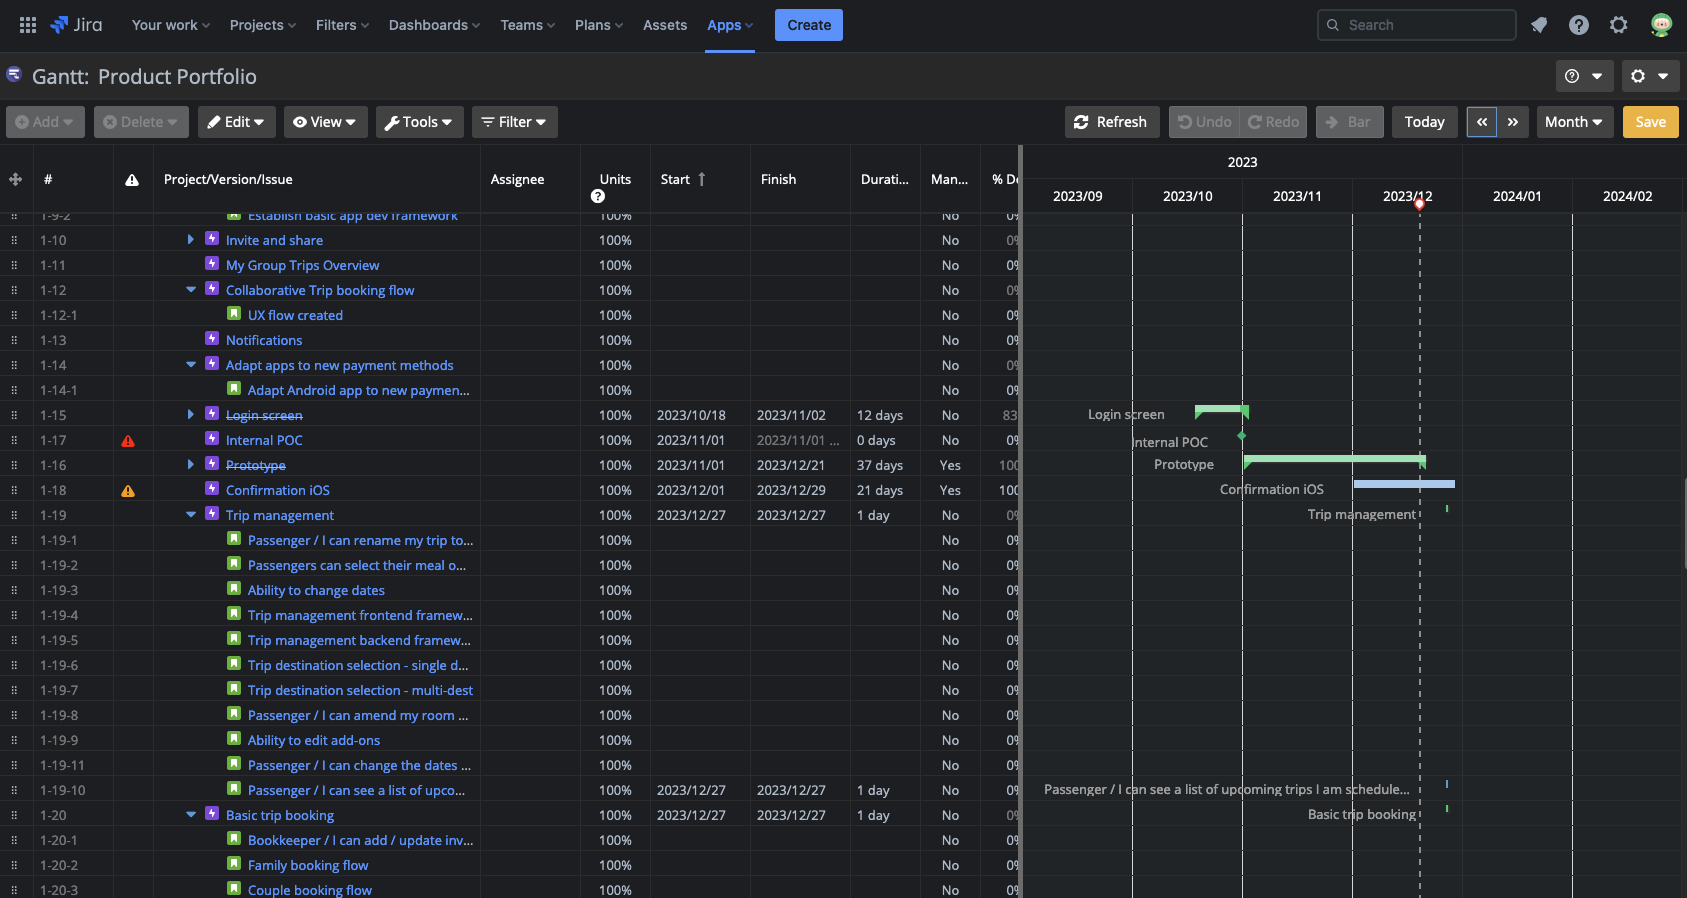
Creating planning charts and visualizing Gantt charts in Jira should be a seamless process. We make it easier than ever to transform your project data into a dynamic and informative Gantt chart.
From the app homepage, you can now generate an instant Gantt chart view for your project, enabling quick insights into timelines and dependencies. No configuration needed! 
Searching for specific data within your project just got more straightforward. The updated JQL search filters enhance intuitiveness thanks to the auto-complete function, allowing you to find and display the information you need with ease. 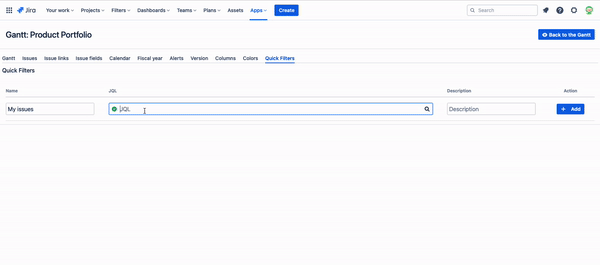
As you embark on your 2024 goals, the enhanced capabilities of WBS Gantt-Chart for Jira Cloud can be your secret weapon for success. We help you extend Jira for complex project needs. The potential is limitless; share your ideas for new features on our roadmap!