News

Jan 14, 2022 • 5 min read

In This Blog
To start the New Year with a bang, we’ve officially launched Excel-like Tables for Confluence today!
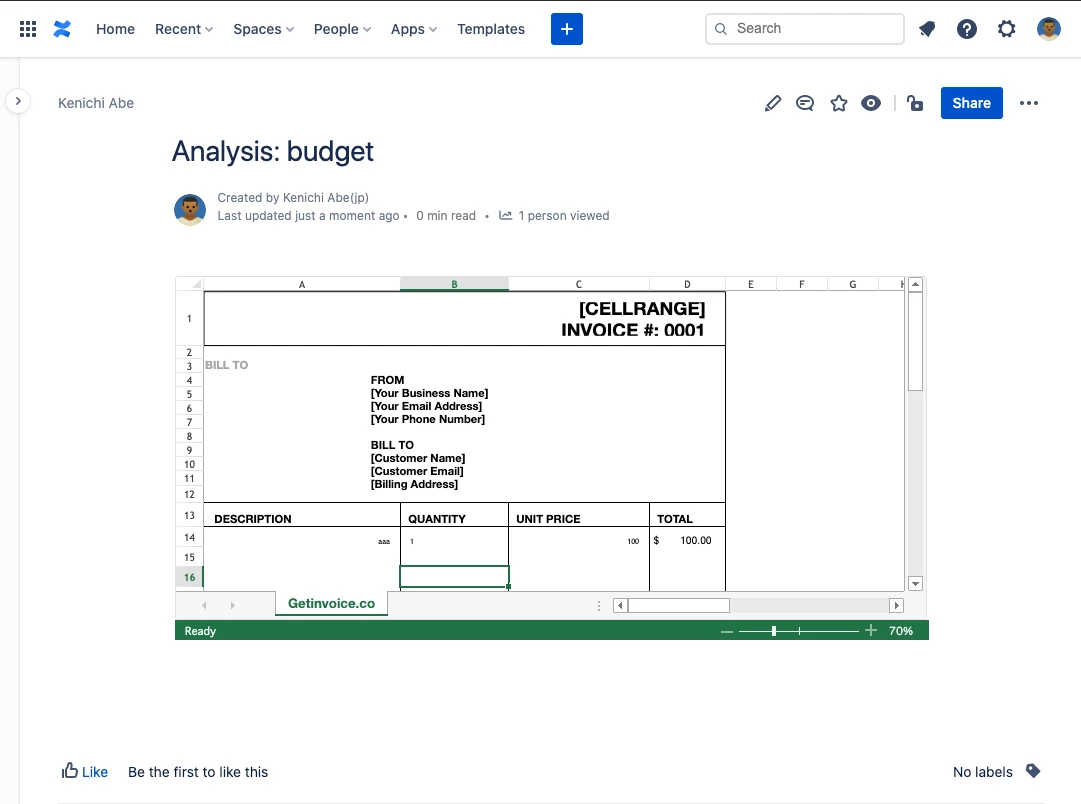
Fresh out of beta testing, our latest app is primed and ready to equip users with the convenient ability to bring the Excel experience right onto Confluence’s doorstep.
Gone are the days of attaching countless Excel screenshots and importing endless external spreadsheets to your Confluence pages. With Excel-like Tables, you’ll be able to utilize Excel spreadsheets, diagrams, charts, and formulas all within the Confluence ecosystem.
Excel-like Tables allow Confluence users to seamlessly take full advantage of Excel’s key functionalities. Here are some of the things you can do:
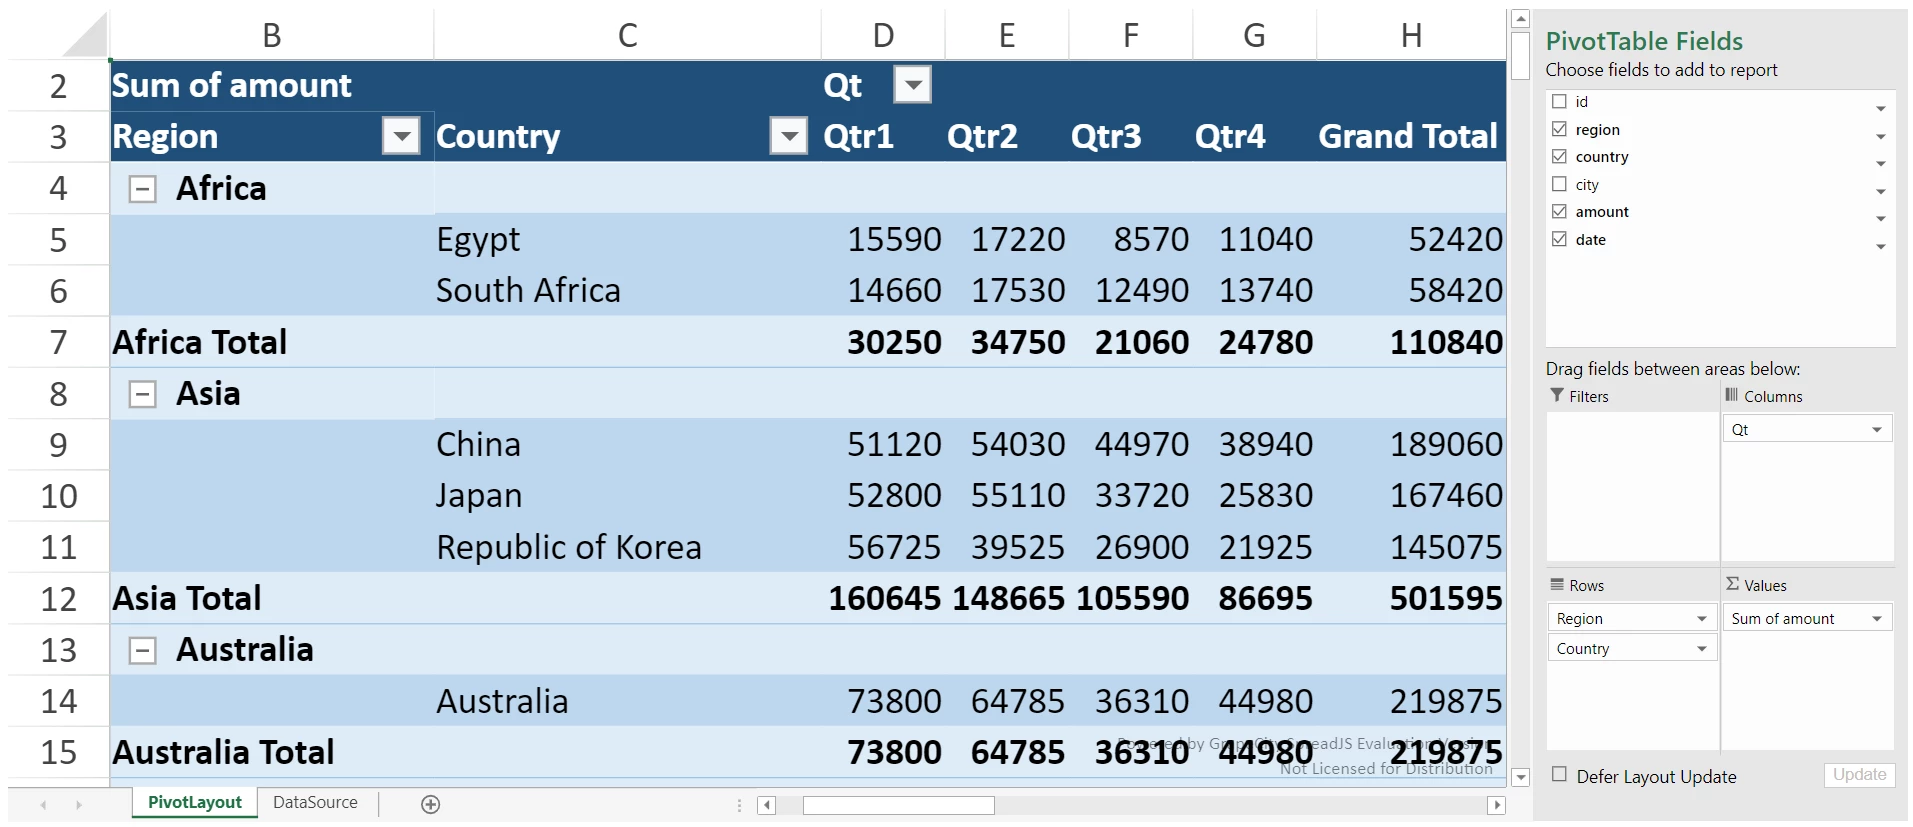
With the app, you’ll be able to conduct data analysis all within Confluence. This is made possible thanks to Excel’s PivotTables. They’re a powerful tool that essentially extracts a large set of data, allowing you to analyze, summarize, calculate, and make comparisons with it. In addition, you’ll also have full access to over 450 built-in formulas that include the simple (e.g., SUM and AVERAGE) and the complex (e.g., BESSELI and NPV). You can write a lengthy formula and get a better view by using our Formula Editor.
To learn how to create PivotTables, you can check out our guide.
It doesn’t matter whether you’re dealing with kilobytes, megabytes, or gigabytes of data. All of your data will be securely stored in Confluence when using the app – except for installation information.
This means that you can rest easy knowing your data will be protected by the Atlassian Cloud’s highest levels of security and encryption.
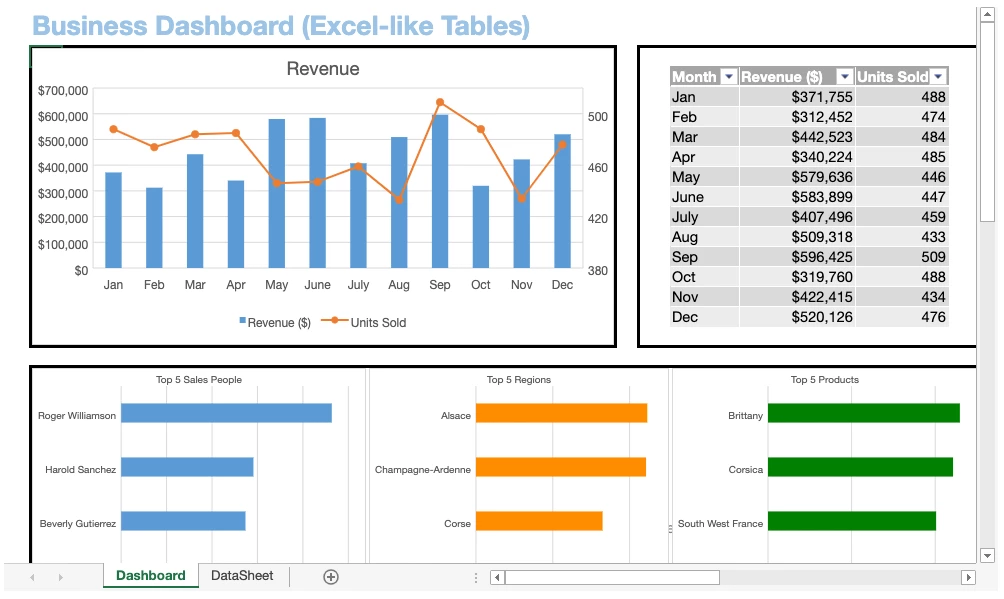
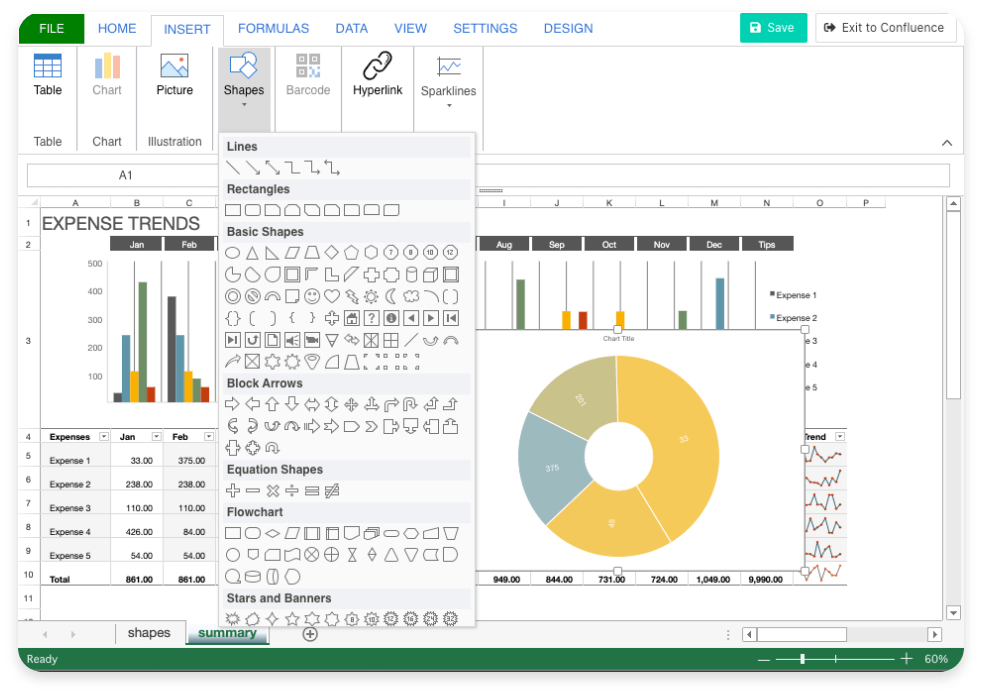
With Excel-like Tables in the palm of your hand, you’ll have the opportunity to utilize Excel’s full arsenal of tables, graphs, and charts. With them, you can now generate scatter plots, pie charts, and complex tables, to name a few, adding visual flair to take your data presentation skills to the next level.
Even creating Gantt charts is entirely possible here with the help of Excel-like Tables. The sky’s truly the limit!
If your work deals with sensitive data, you’ll know full well how important it is to keep certain information secure and restricted to only those who legitimately need access. The last thing you’d want for your organization’s reputation is a data breach!
With Excel-like Tables, your pages will automatically use the same permissions as originally set by you on Confluence. This also means that whatever tables and graphs you create on your pages will stay within your Confluence instance.
Struggling to ensure your project stays on course? Download our free e-book today to learn about effective project management!

Uniting Confluence with Excel couldn’t be more important these days in order to bring out the most in your projects and teams. So now that you know the major ins-and-outs of Excel-like Tables, why not test the waters yourself to see how it can benefit you?
Pricing will differ depending on the total number of users in your organization. Prices start at $0 for up to 10 users and will go up to $5600 for 20000 users. Additionally, do note that the app is only available for Cloud users. Here’s a detailed breakdown:
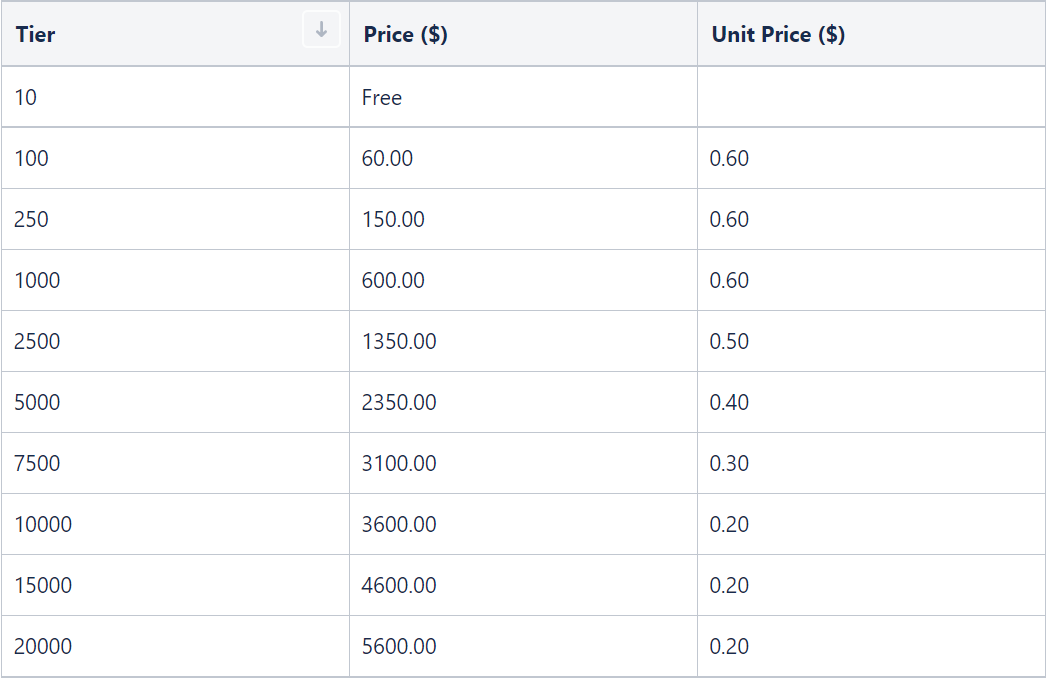
After the official release of the app on January 13, 2022, Excel-like Tables will no longer be free to use if you have 11 or more users in your organization.
If you have any feedback to give, we invite you to either leave a review on the Atlassian Marketplace or send us an email directly to excel-like-tables-request@ricksoft-inc.com.
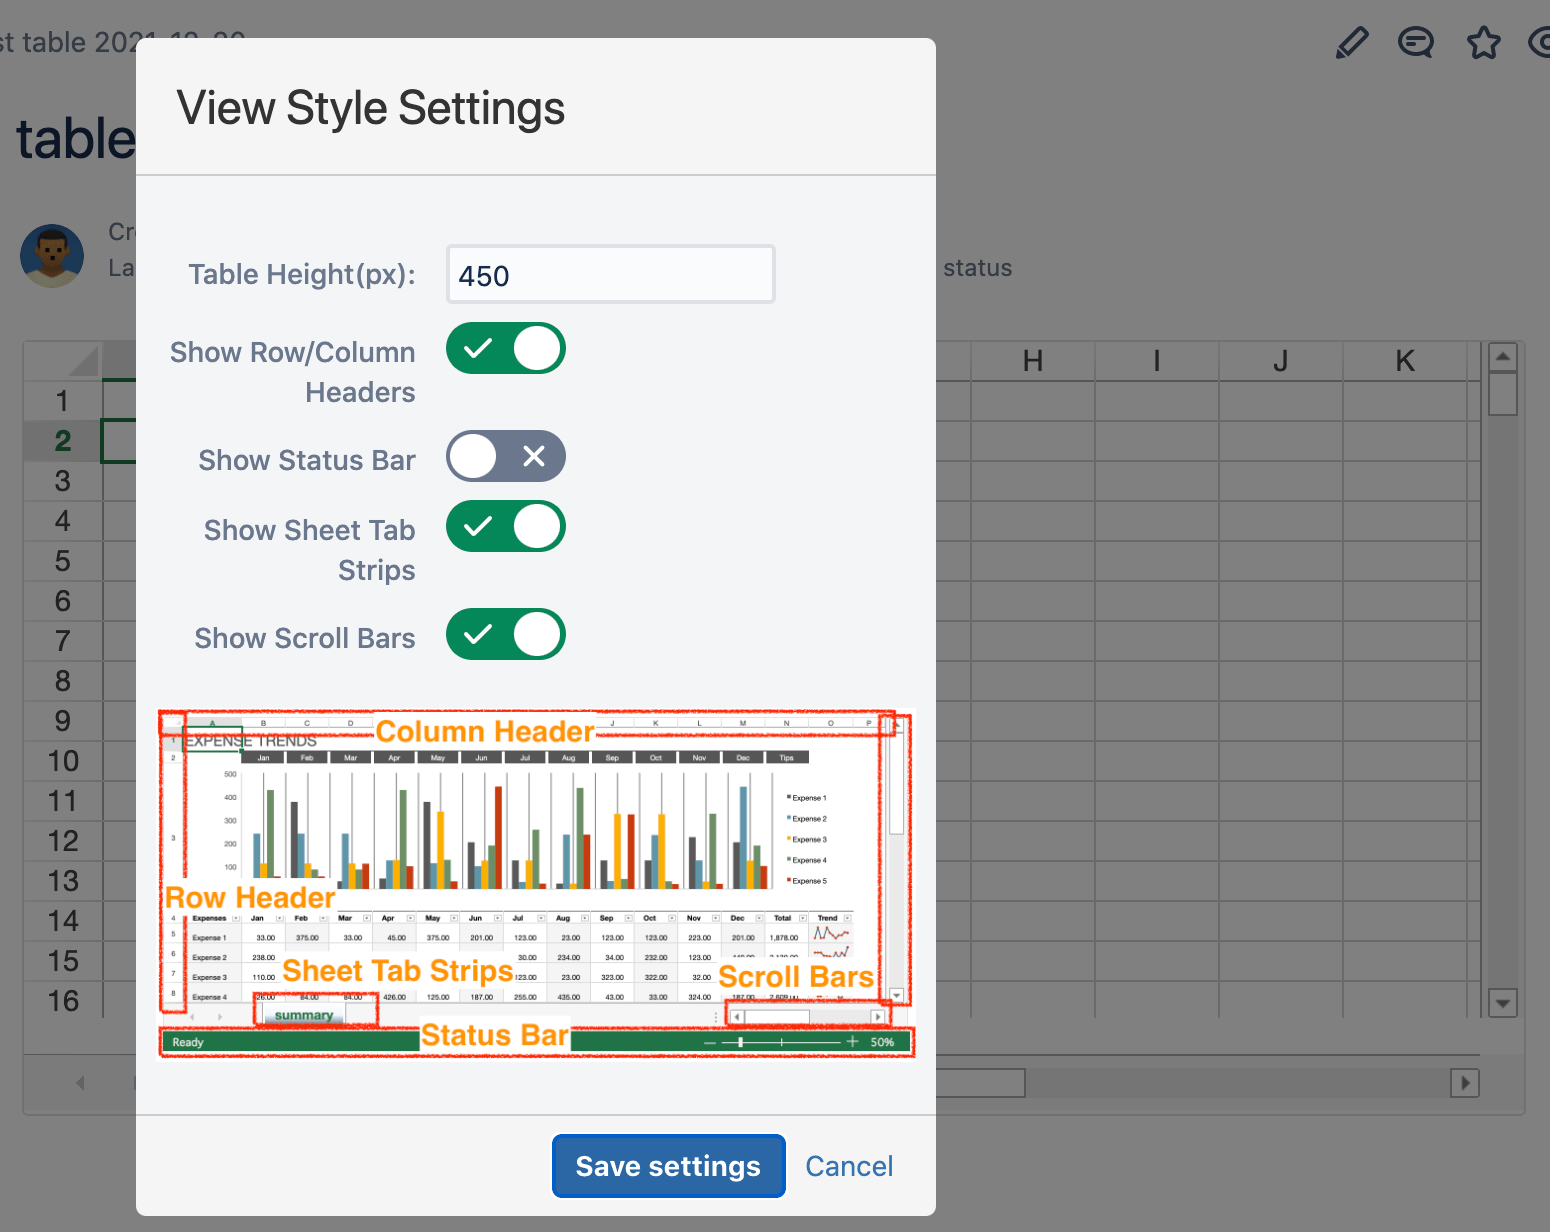
With the paid version, you can expect several quality improvements such as over 40 bug fixes! You’ll also find a ‘View Style’ setting that’ll allow you to adjust the height of your tables, enable the visibility of status bars, scroll bars, and more.
In the long run, more features will be added such as:
Absolutely! All of your data will be able to be used and stored even as we make the switch from the beta to the full release.
