Mastering Project Management with Jira Gantt Chart: The Ultimate Guide
Introduction
We all have deadlines. And Gantt charts help teams reach them by visualizing tasks over time, dependencies mapping, resource allocations, and more. The bigger the project, the more stakeholders involved, and the more dependencies there are. The more a Gantt chart can help you keep track of it all and meet your deadline.
But not just any Gantt chart. Meet the Jira Gantt Chart, a game-changer in project management! You can wing-it with a variety of tools, hope to hit those deadlines accurately (fingers crossed), or use what the smart ones do- leverage a helpful tool that elevates planning to another level of efficiency altogether.
Ready to learn more about Jira Gantt charts? Let’s dive in.
Keep reading
to learn how to use Gantt charts for project management.
What is a Gantt Chart?
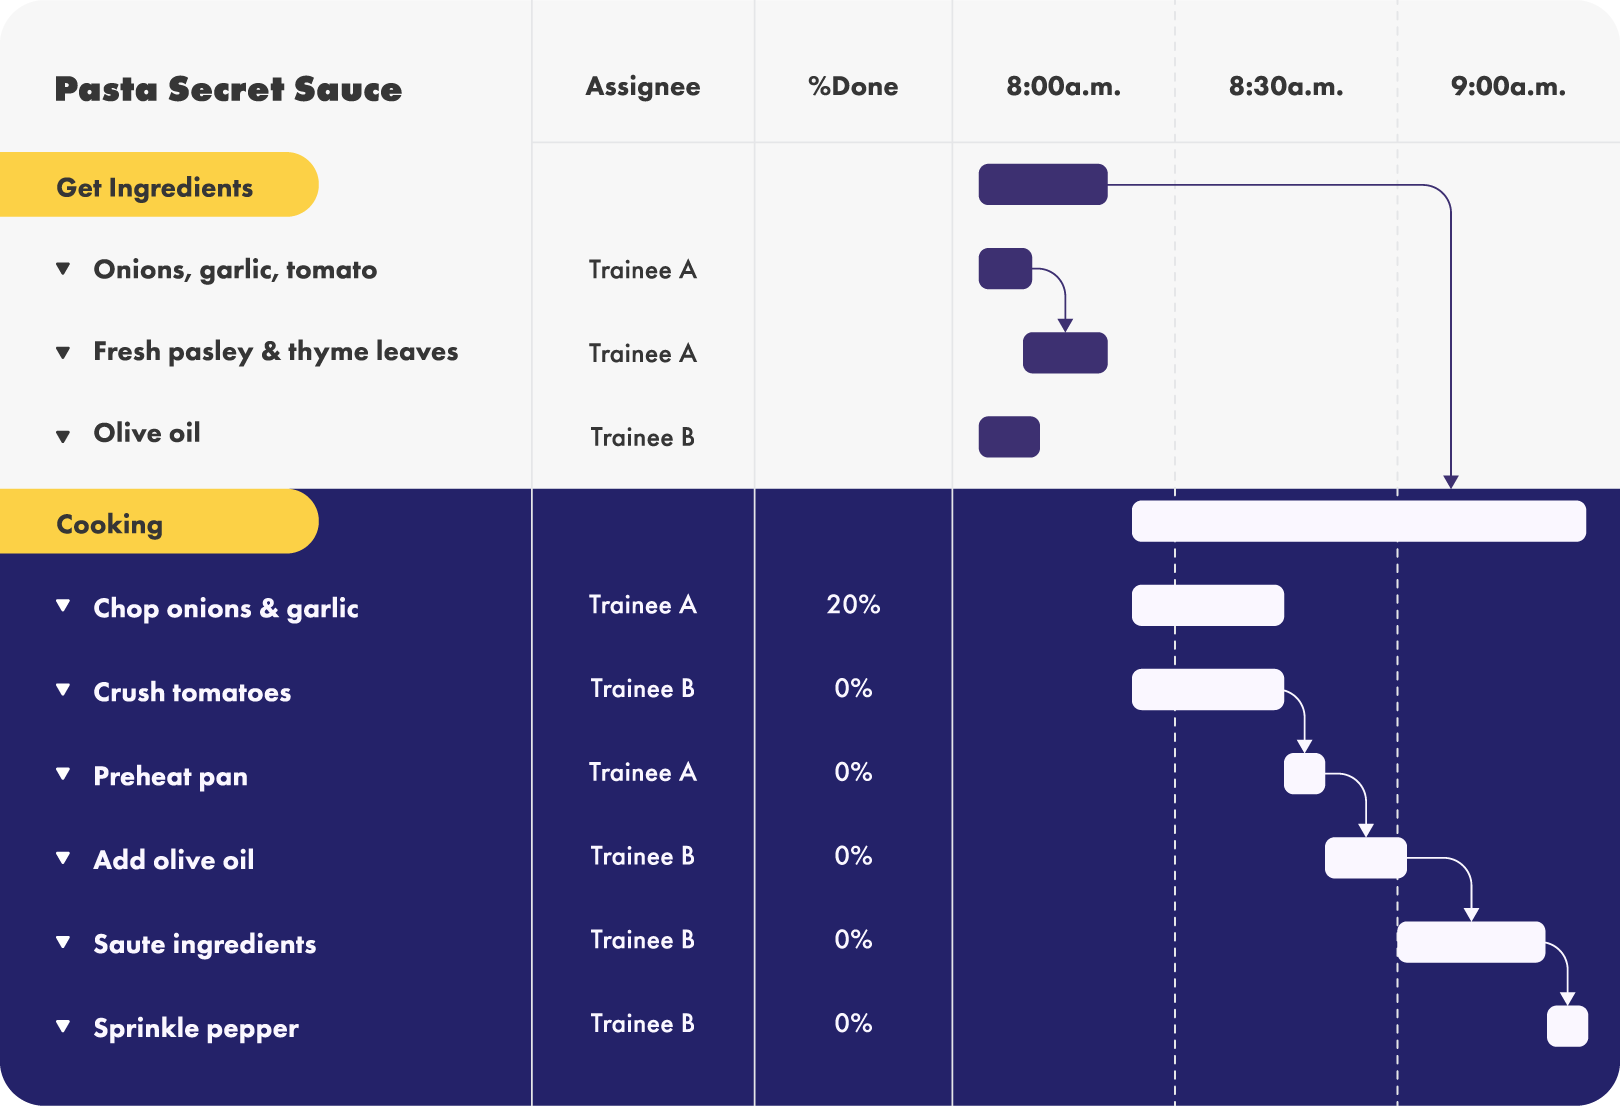
A Gantt chart is a horizontal bar chart that shows a project plan over time. It provides a convenient way of visualizing all the tasks, which are “issues” in Jira, in sequential order.
The Benefits of Using Jira Gantt Charts
for Project Management
Project management isn’t easy. You have to juggle multiple contributors and teams, numerous activities, and a diverse range of stakeholder expectations to make sure it all comes in on time and on budget. Jira Gantt charts help by allowing you to see all the work that needs to be done, what resources are available, and how the project plan will play out over time.
Visualize Your Entire Project Plan on a Timeline
Keeping track of start and end dates in a spreadsheet is a headache. With a Jira Gantt chart, you’re easily able to visualize each task and the entire project schedule. This allows everyone to see how their work fits into the big picture.
Set Dependencies and See Critical Paths
You can’t make an omelet without breaking an egg. This is a dependency. Gantt charts in Jira enable project managers to identify and visualize dependencies. This allows you to understand how to sequence and prioritize tasks, and it shows you how one delay can impact the rest of your project plan.
Track Your Progress Against Milestones
Just as tasks allow you to break your elephant-sized project into bite-sized pieces, milestones can be used to divide the timeline into manageable project phases. Jira Gantt charts make it easy to visualize your milestones and see your progress as your team drives toward them.
Update Your Plans on the Fly
Gantt charts used to be very tedious and time-consuming to make and update on paper. Thanks to modern project management software, it’s now possible to instantly update your tasks and timeline simply by dragging and dropping them into place. With many applications, like WBS Gantt Chart for Jira, adjusting the completion date for one task will automatically update the schedule for other dependencies. This makes it easy for you to keep track of constantly changing project plans.

Gantt charts were originally created for the waterfall methodology of project management, which were used in the manufacturing industries. Waterfall describes an approach to breaking down a project into sequential, linear phases, where each phase must be completed prior to proceeding to the next one. There is no return to a completed phase.
Because of their origins in waterfall project management, some have questioned the usefulness of Gantt charts for agile project management methodologies. Unlike waterfall, agile methodologies take a continuous, highly iterative approach to planning, development, implementation, and testing. This is ideal for software development allowing teams to build features based on customer feedback, fix bugs before they become bigger issues, and deliver innovation faster and more frequently.
Yet, there are very few pure agile organizations. Agile teams frequently collaborate with non-agile teams, as well as internal stakeholders who stubbornly insist on project milestones and ship dates. Gantt charts give project management professionals (PMPs) a convenient tool for communicating with these audiences.
Benefits of Gantt Chart for Agile Teams
- Provide a unified vision for the project and product roadmap across teams
- Enable teams to take ownership of their work and schedule
- Easier to explain to an executive than a burndown chart
- Simplify project planning and sprint tracking across multiple teams
- Visualize project schedules and dependencies within and between sprints
- Easily move tasks into or out of your sprints, track progress, and manage resources
How to Make a Gantt Chart in Jira
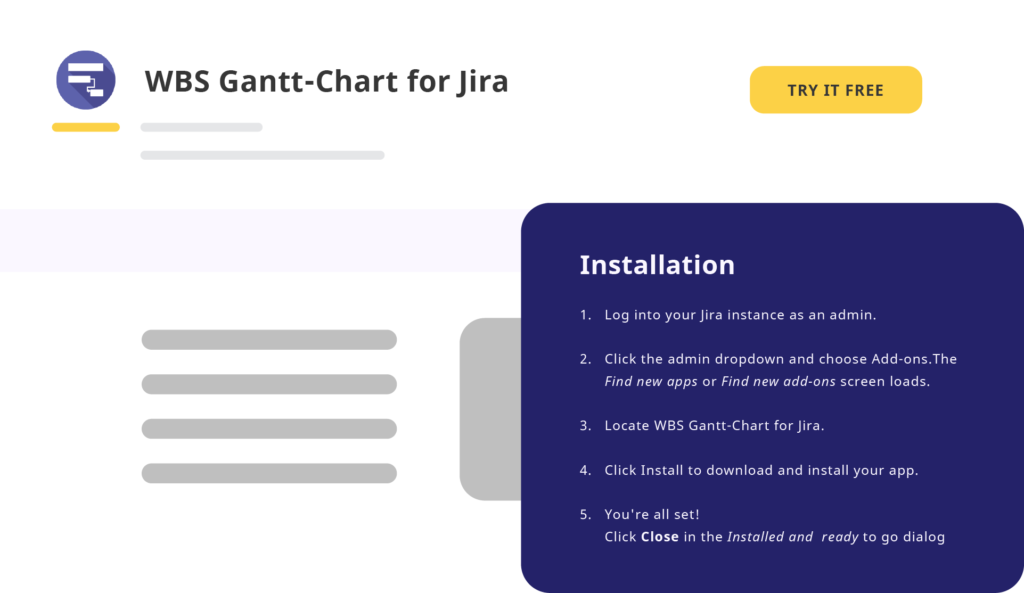
Install a Gantt Chart App
Sign up for a 30-day free trial of WBS Gantt Chart in the Atlassian Marketplace, and follow the simple instructions to install the app.
Not sure if this tool is right for you? Read this review by Chris Fredrick:
“WBS Gantt-Chart integrates well with Jira and represents the Jira issues well as waterfall oriented Gantt charts. Their support staff is very responsive and helpful to address many questions. I worked with 3 individuals who all went over and above to help me with the integration and setup of WBS Gantt-Chart. I recommend this tool for anyone who is still doing waterfall or some flavor of it.”
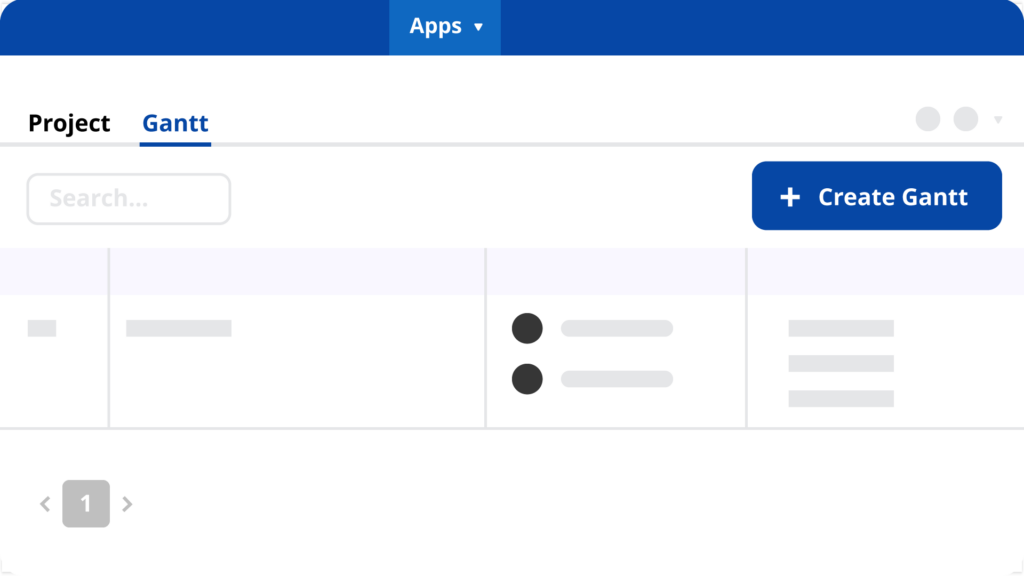
Create a Gantt Chart
Already have a project in Jira? Then you’re just a few quick steps away from creating a Gantt chart. To get started, simply open WBS Gantt-Chart from the top-level Apps menu. From the app homepage, you can open a Gantt chart view from an existing project or click on Create Gantt to start a new one.
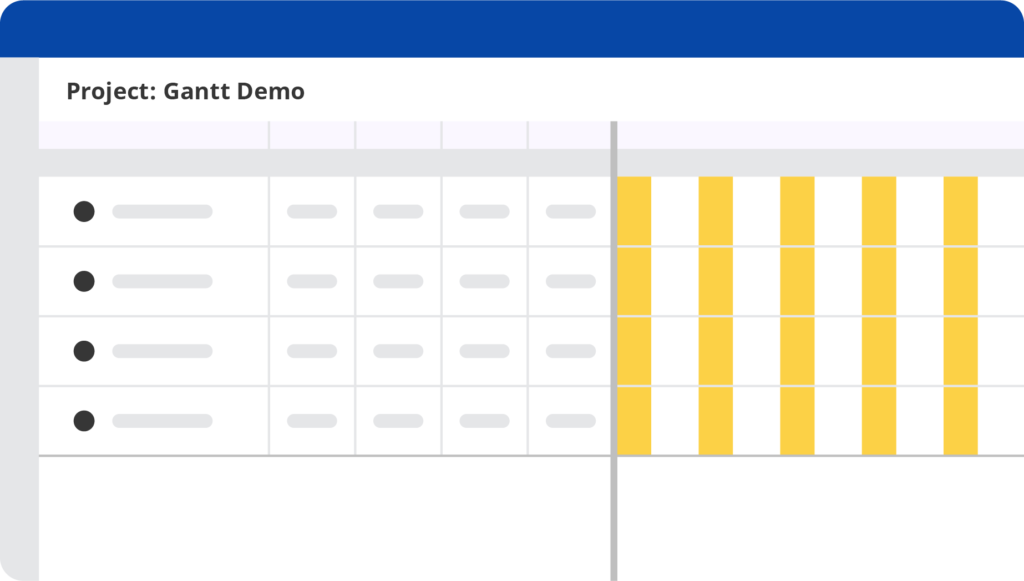
This brings up a wizard that lets you name your Gantt chart and, with a simple click, select from existing projects or filters to add to the Gantt chart. You’ll instantly see all issues on the work breakdown structure column.
Schedule Your Projects
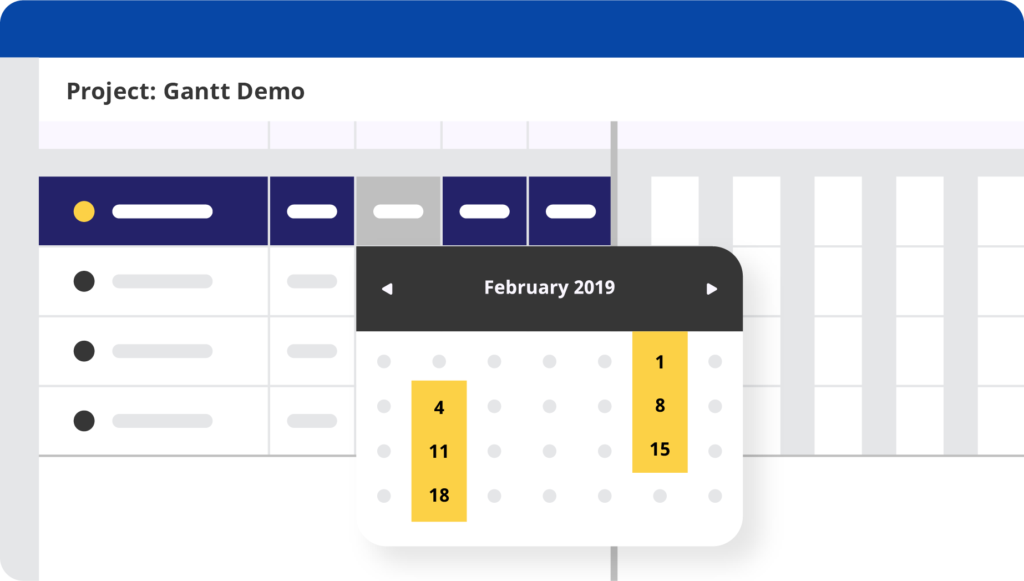
Project planning is easy with WBS Gantt-Chart. To start scheduling our plan, simply edit the Start and Finish dates on the WBS display. Don’t want to manually calculate Finish dates? No problem. You can enter the Start date and Duration. The app will automatically account for nonworking days to calculate the Finish date.
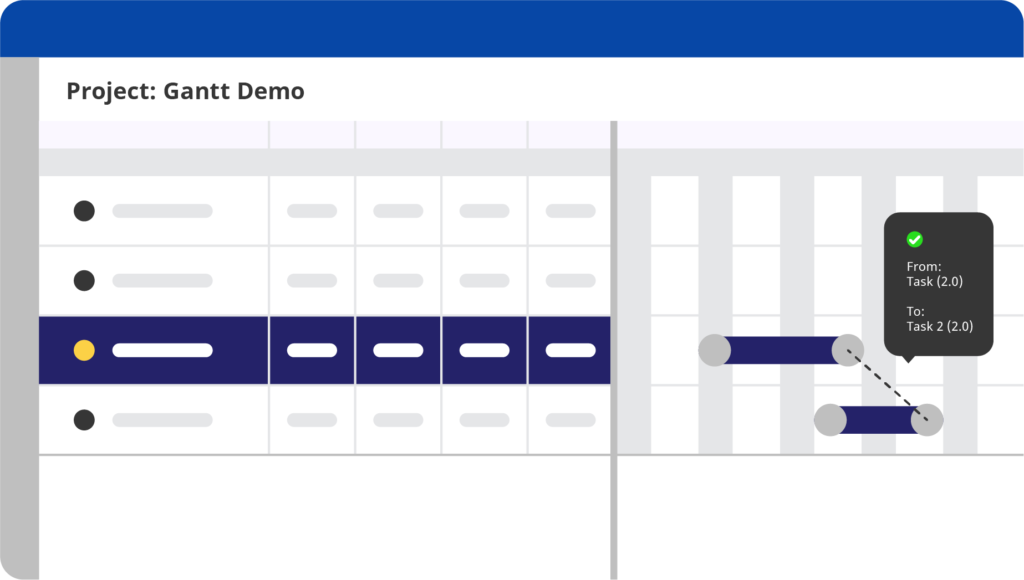
The great thing about Gantt charts in Jira is being able to visually see and update your plan to maintain agility. With WBS Gantt-Chart for Jira, you have the power to instantly adjust task schedules by dragging and dropping either end of a task bar.
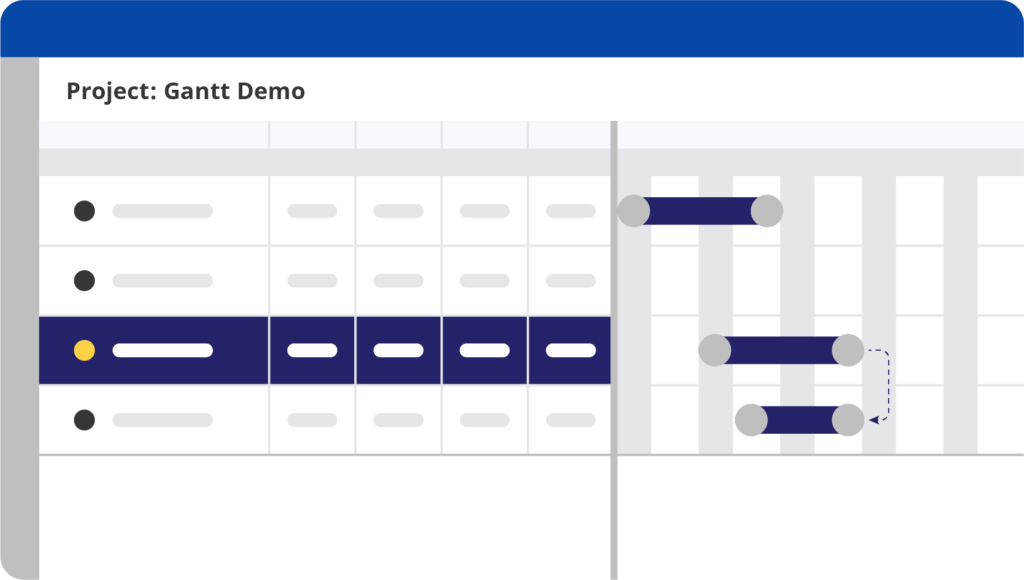
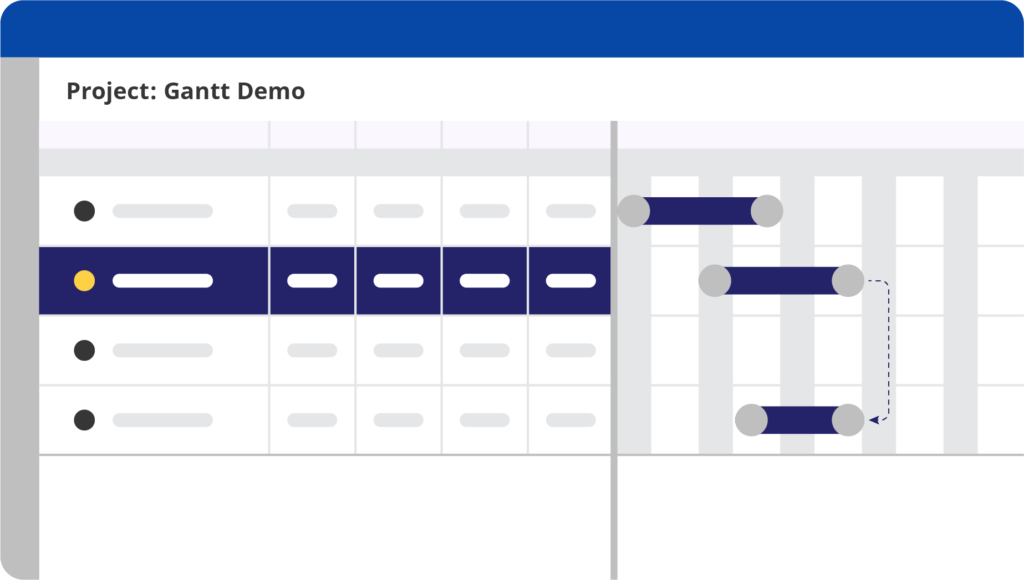
Need to create a dependency in Jira? Simply click on the beginning or end of a task bar, and drag it to connect it to the beginning or end of another task. The app supports four types of dependencies: Start-Start, Start-End, End-Start, and End-End. Now, whenever the schedule changes for one issue, the Gantt chart will automatically adjust the schedule for the dependent issue.
WBS Gantt-Chart for Jira is tuned for enterprise-scale project management. Unlike other Jira add-ons that automatically save every change, WBS waits until you’re ready to save your updates. This enables you to freely “play” with your schedule, without sending unnecessary notifications to your team or leaving you waiting on a slow server.
Add Tasks, Epics, and Versions
You can create new Jira issues or versions directly from the Gantt chart by clicking the Add button in the operations toolbar.
Then, drag-and-drop the newly created tasks to prioritize and schedule work without jumping between Jira projects and issue views.
WBS Gantt-Chart is seamlessly integrated with Jira. That means you have complete control over your Jira issues from the comfort of your Gantt chart dashboard. Need to update the Assignee, Priority, or other Jira issue fields? Double-click on the fields to perform in-line edit, and hit Save when you’re done. Working in Jira couldn’t be any easier.
Track Progress and Visualize Your Success
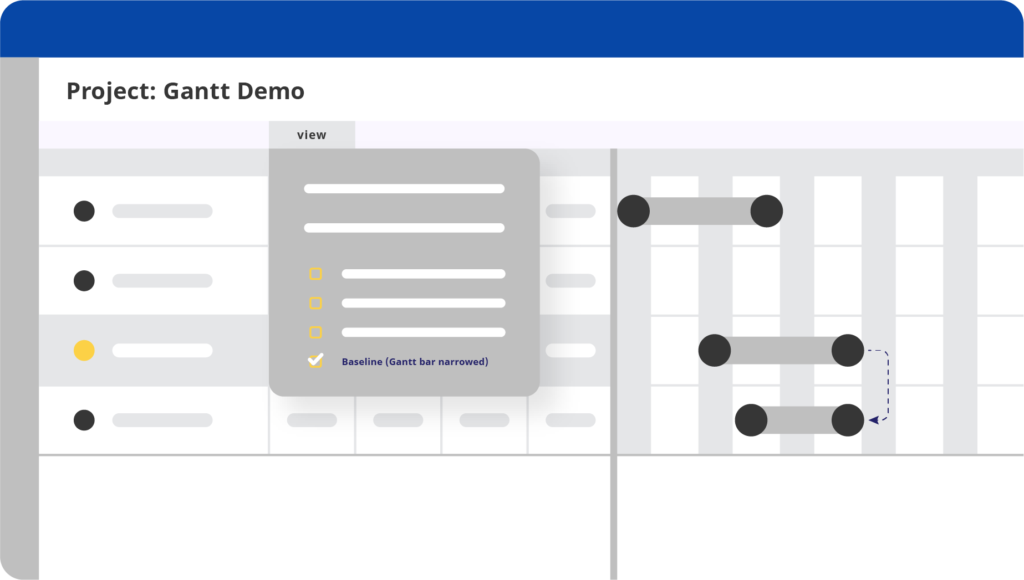
Once you’re done planning your project, you’ll want to save it as a Baseline Plan so you can keep track of your progress and identify deviations from the initial scope.
From the Views dropdown in the operations menu, select Baseline. Now you’ll see light gray colored bars underneath your tasks showing the Baseline Plan. This makes it easy to track whether you’re ahead or behind schedule.
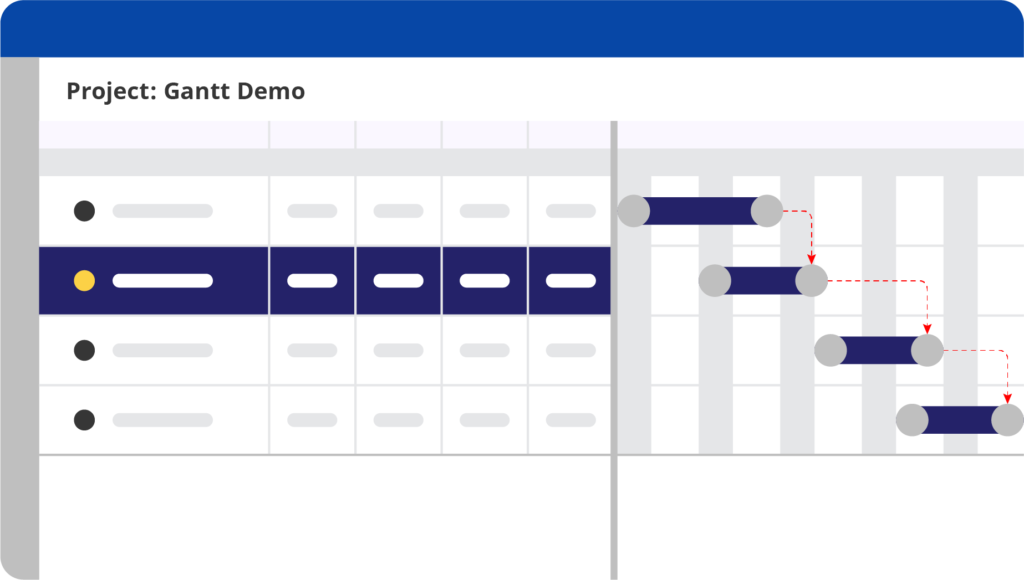
No Gantt chart would be complete without a Critical Path feature. To see the critical parts of your project, go to the Tools dropdown, and select Critical Path. This highlights dependencies between tasks and gives you an instant snapshot of tasks that directly affect your project schedule.
WBS Gantt-Chart for Jira Tutorial
How to Choose the Best Gantt Chart App for Jira
There are currently more than half a dozen Gantt chart apps in the Atlassian Marketplace, including Ricksoft’s popular WBS Gantt-Chart for Jira.
Below we provide an overview of key Gantt chart features to help you select the best app for your project management organization (PMO).
Must-Have Gantt Chart Features

Milestones
Projects are full of milestones—look for a Gantt chart app that supports them. They’ll allow you and your teams to quickly see important dates and how you’re tracking against them.

Create Dependencies
No Gantt project would be complete without dependencies. Look for an Jira Gantt Chart app that makes it easy to link tasks and then automatically updates your project schedule based on changes to dependent tasks.

Critical Path View
As a PMP, you know that some tasks are more important than others. The critical path is the series of dependencies that directly impact the finish date of your project. You should look for an app that lets you see the critical path at a glance, so you never lose sight of your finish line.
Baseline Plan Tracking
Need to know how well your original project plan worked? Some Jira Gantt chart apps let you save and highlight the baseline plan, so you can easily see where your estimates were off and learn how to improve your project planning in the future.

Jira Integration
There’s a big difference between a “Jira Gantt view” and a “Jira Gantt chart.” The first only provides a static graphical overlay of your Jira issues, without any ability to edit the tasks from within the Gantt view. A proper Jira Gantt chart plugin provides full integration with Jira, allowing you to modify issues, view issue details, modify schedules and more from within the Gantt chart in Jira.
Key Considerations for a Jira Gantt Chart App
User Interface (UI)
One of the great things about the Atlassian Marketplace is that you can sign up for a free trial of any app. You should take advantage of this opportunity to test the usability of any Jira Gantt chart apps you’re considering. Look for an app that is easy to use, with an intuitive UI. This will facilitate adoption and save your users from the frustrations of learning new software. If you’re coming from another Gantt chart software like Microsoft Project, selecting an app that has a similar look and feel can help users get up to speed quickly. Lastly, think about whether or not your teams would benefit from being able to customize the UI or project templates. Some Gantt chart apps provide a lot more flexibility here than others.
Enterprise-grade Performance
How many users and issues do you need to support, today and tomorrow? This is a critical consideration when selecting a Jira Gantt chart app. Some of the apps in the Atlassian Marketplace were built to help small teams get started with Gantt charts. They work great for small teams and projects, but they don’t offer the features, customizability, or system performance required to perform at scale. Likewise, you should be wary of apps with autosynching functionality. If you’re a PMP dealing with hundreds or thousands of issues, the last thing you want is to wait for the server every time you update a task.
Market Proven
One of the best ways to validate your decision is to confirm that other businesses like yours are successfully using it. Be sure to read reviews, check customer references, and talk to other Gantt chart users to make sure that the app will work for your teams. Then, take advantage of the free trial to confirm your decision.
FAQs (Frequently Asked Questions)
What is the difference between Gantt and Agile Gantt?
A traditional Gantt system uses the traditional waterfall project management system, which is used in manufacturing and construction. This heavily focuses on timelines with strict start and end dates.
On the other hand, Agile Gantt charts allow more flexibility, the iterative process, and adaption. They are still allowed to see a waterfall visual overview but without strict starting and ending dates, which lets development groups take their priorities over again, based on current conditions.
Is Jira better than Microsoft Project?
For users already proficient in utilizing complex software and seeking an advanced project planning solution, Microsoft Project could be a viable choice.
However, for individuals prioritizing a user-friendly interface with seamless workflow automation and collaboration features tailored for agile product development, Jira presents a compelling choice.
Organizations aiming to transition from traditional waterfall methodologies to agile practices may find Jira combined with apps like WBS Gantt-Chart, beneficial for maximizing productivity and efficiency.
Does Jira have a Gantt chart?
Yes, Jira offers users the ability to build Gantt charts using two roadmap tools: Timelines (formerly known as Roadmaps) provide a simplified roadmap view of issues within a project
while Plans (also known as Advanced Roadmaps) is only available in Jira Premium and Jira Enterprise.
Jira’s Timeline feature is great for visualizing a project roadmap. However, if you manage a project portfolio, you’ll need advanced features like cross-project tracking, dependency mapping & resource planning capabilities. That’s where Jira Gantt chart comes in!
By incorporating Ricksoft’s WBS Gantt-Chart for Jira, generating Gantt charts within Jira is effortless, enhancing resource management by providing a clear visualization of each team member’s workload. Additionally, the tool alerts you if a team member’s capacity is overestimated, facilitating efficient task redistribution.
Discover the Power and Simplicity of Jira Gantt Charts for Project Management
When you have thousands of Jira issues standing between you and success, there’s only one app you can count on to manage dependencies, master milestones, and keep your projects on schedule.
WBS Gantt Chart for Jira is built for enterprise-grade collaboration. It’s lightning-fast, packed with features, and surprisingly easy to configure and use. Try it today for free, and see why innovation leaders like Toyota, Bosch, and Google trust it to handle their biggest and most important projects.