Project Management

Nov 9, 2021 • 7 min read
In This Blog
Planning is an intricate, critical part of project management. If you don’t plan well, you won’t be able to bring the project into development successfully or meet its objectives.
You also need to be detail-oriented because the planning process involves scheduling, breaking down work into the smallest units, defining dependencies, establishing a timeline, allocating resources, outlining the milestones, and so on.
This is why project planning often goes hand in hand with Gantt charts. The tool has been used exclusively to support all the processes during planning and enables a bird’s eye view of your project lifecycle.
Even now, with the advent of project management tools like Jira, project managers can still benefit from the use of Gantt charts – some still rely on it by switching between Jira and Microsoft Excel.
But why go through such trouble when you can bring Gantt charts to Jira? More importantly, how can you further escalate project planning in Jira with greater flexibility?
Read on to find out.
How do you create a Gantt chart in Jira? Well, out-of-the-box Jira doesn’t offer any Gantt chart capabilities.
You have the native roadmap feature which allows you to view all the epics and issues in your project against a foreseeable timeline – but you can’t chart your milestones or schedule your tasks extensively.
This is where WBS Gantt-Chart for Jira comes into the picture. It offers a familiar excel-like interface and intuitive features for a smooth project planning experience. Other feature highlights include the following:
You can build a chart for a single project that you’re managing or for multiple projects at once.
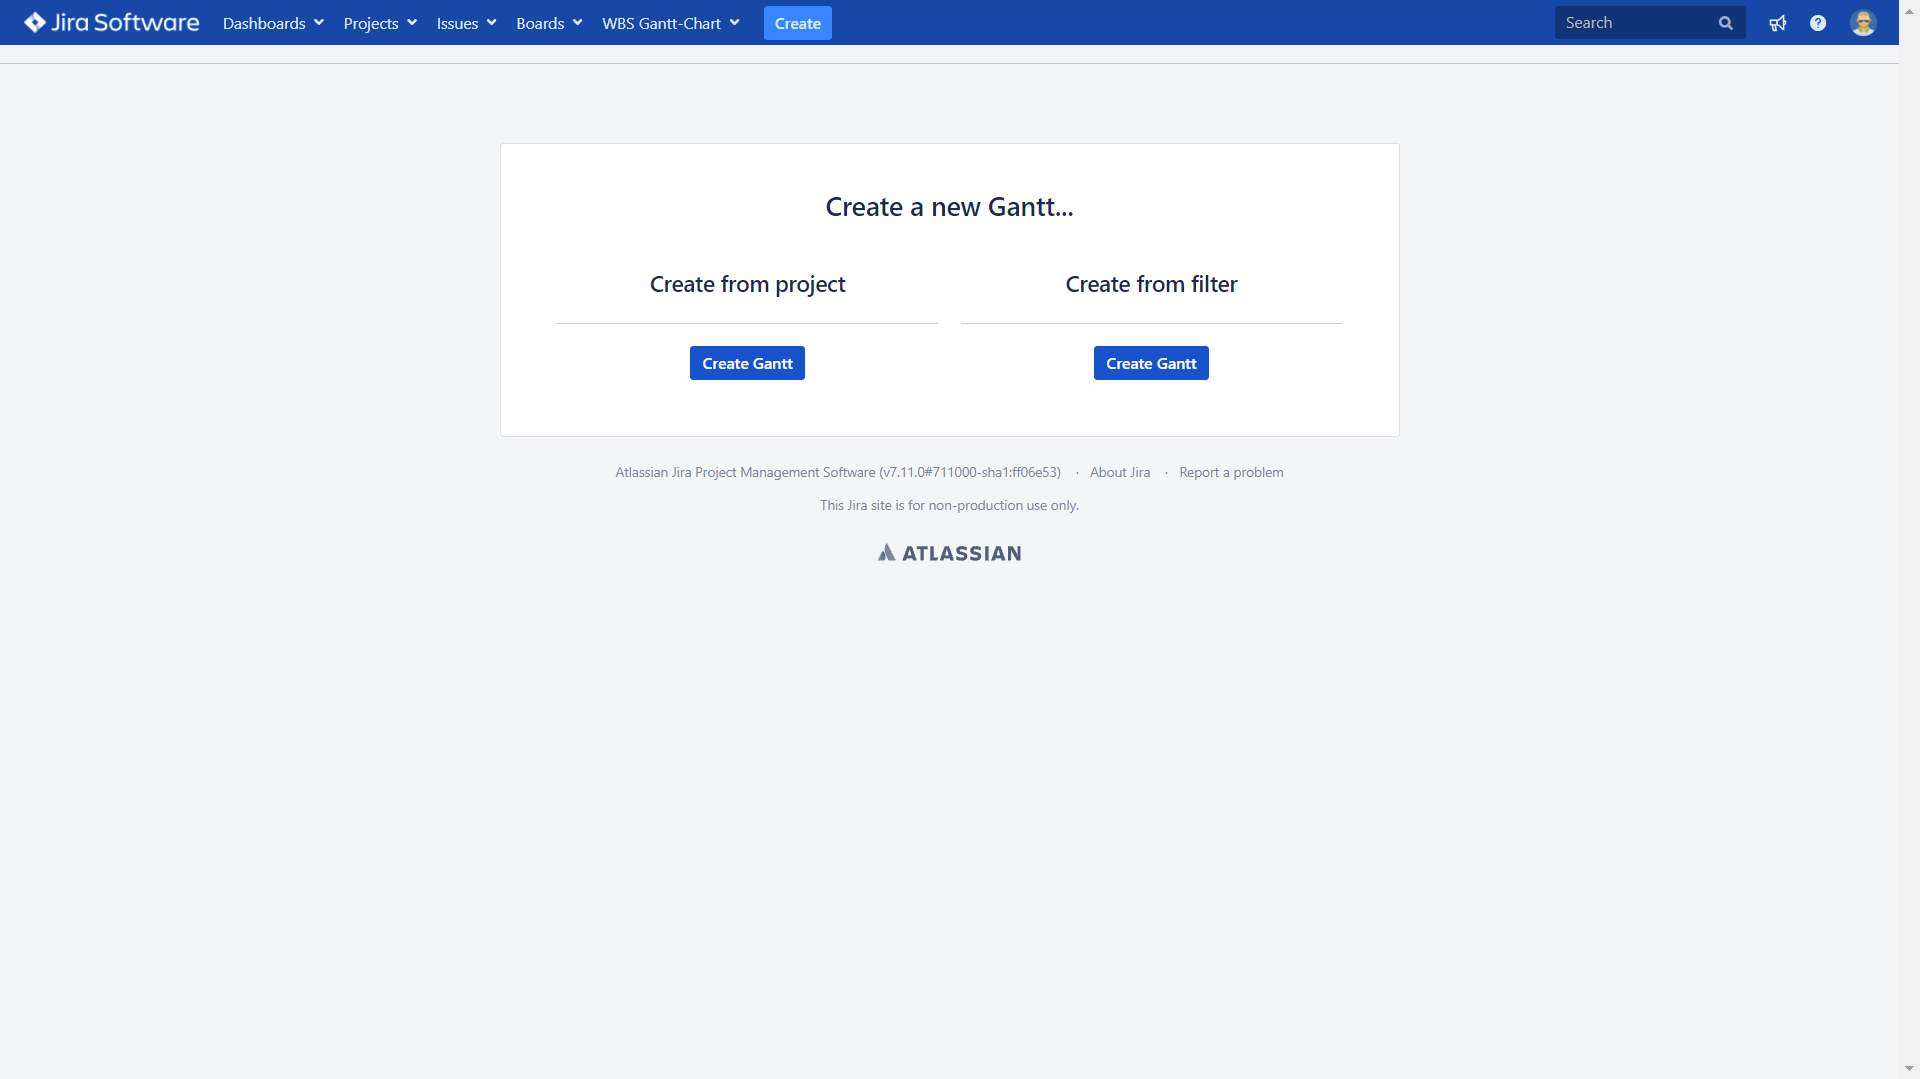
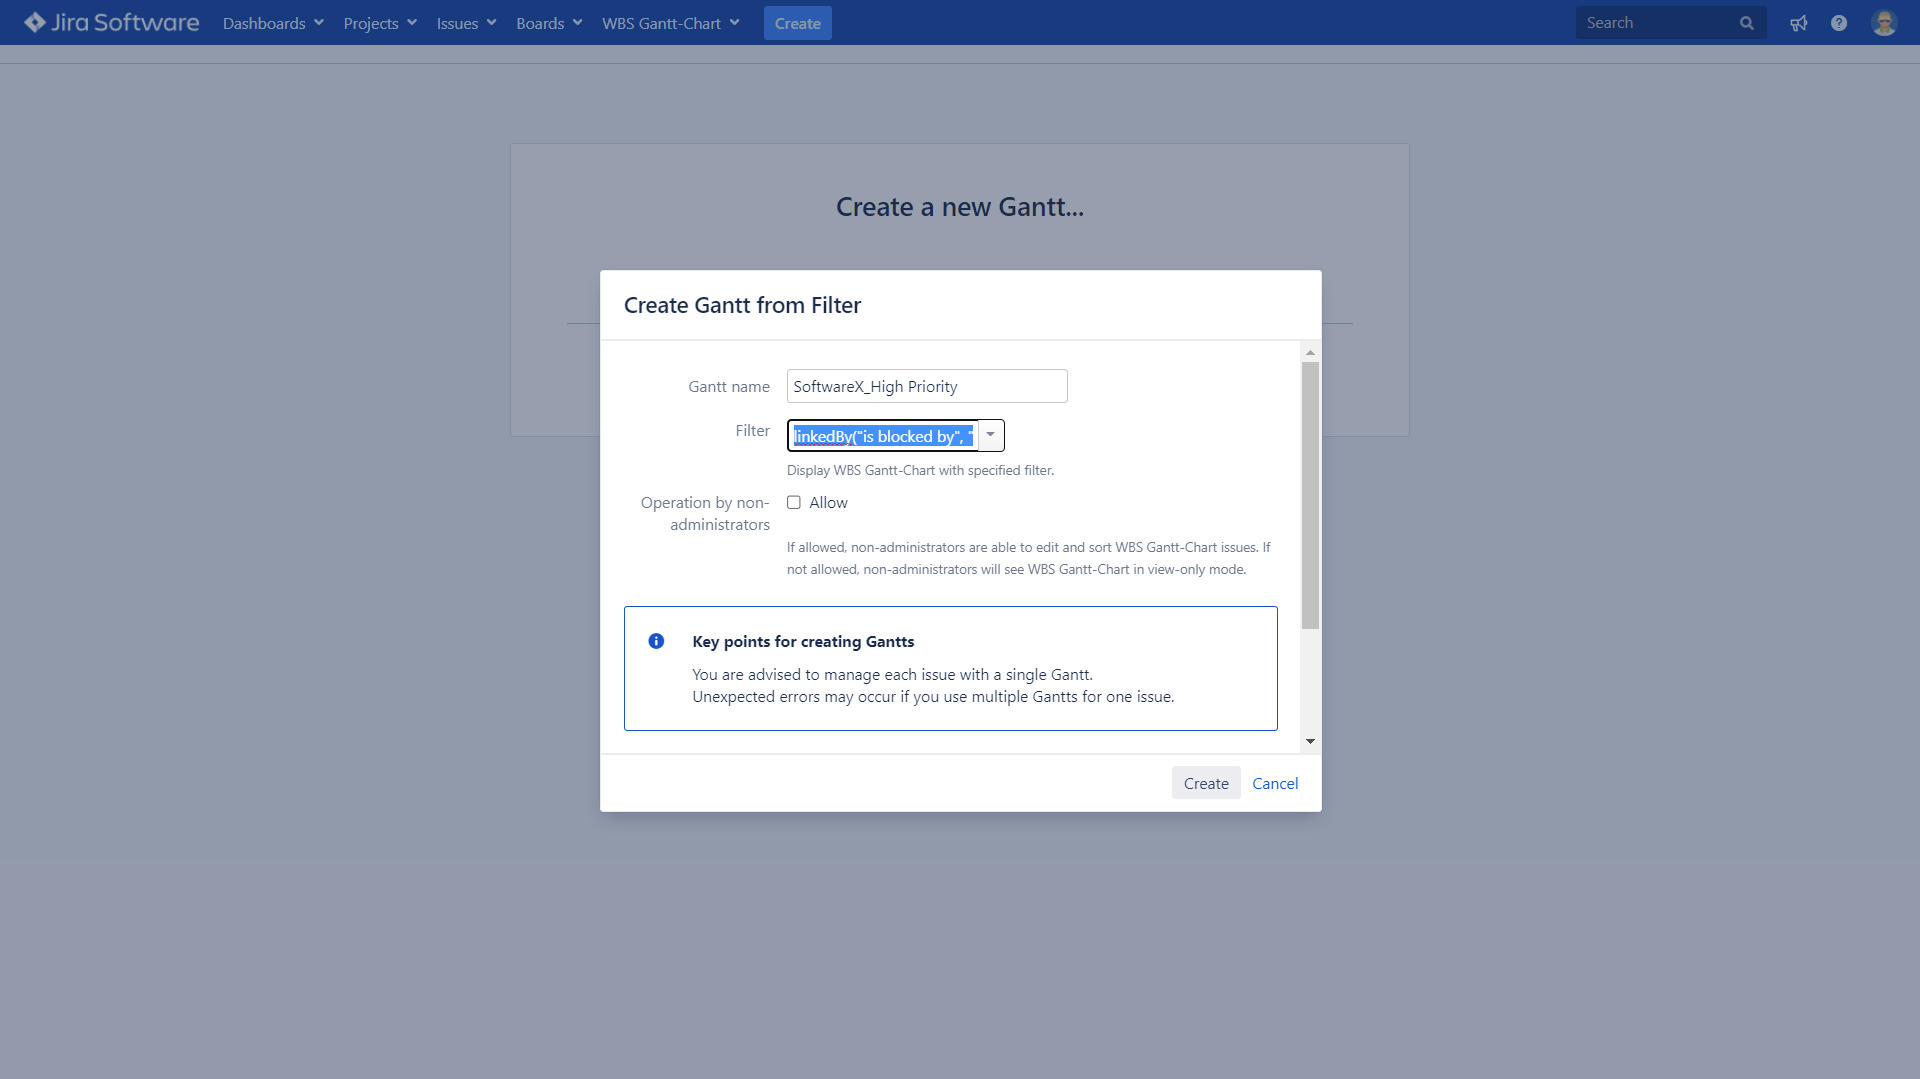
Once you have installed the WBS Gantt-Chart for Jira app, you can start creating your charts. Launch the app from your Jira dashboard. From the Apps dropdown list, select WBS Gantt-Chart. From the dashboard, click on Create Gantt. You can choose to create a Gantt chart from Projects or Filter.
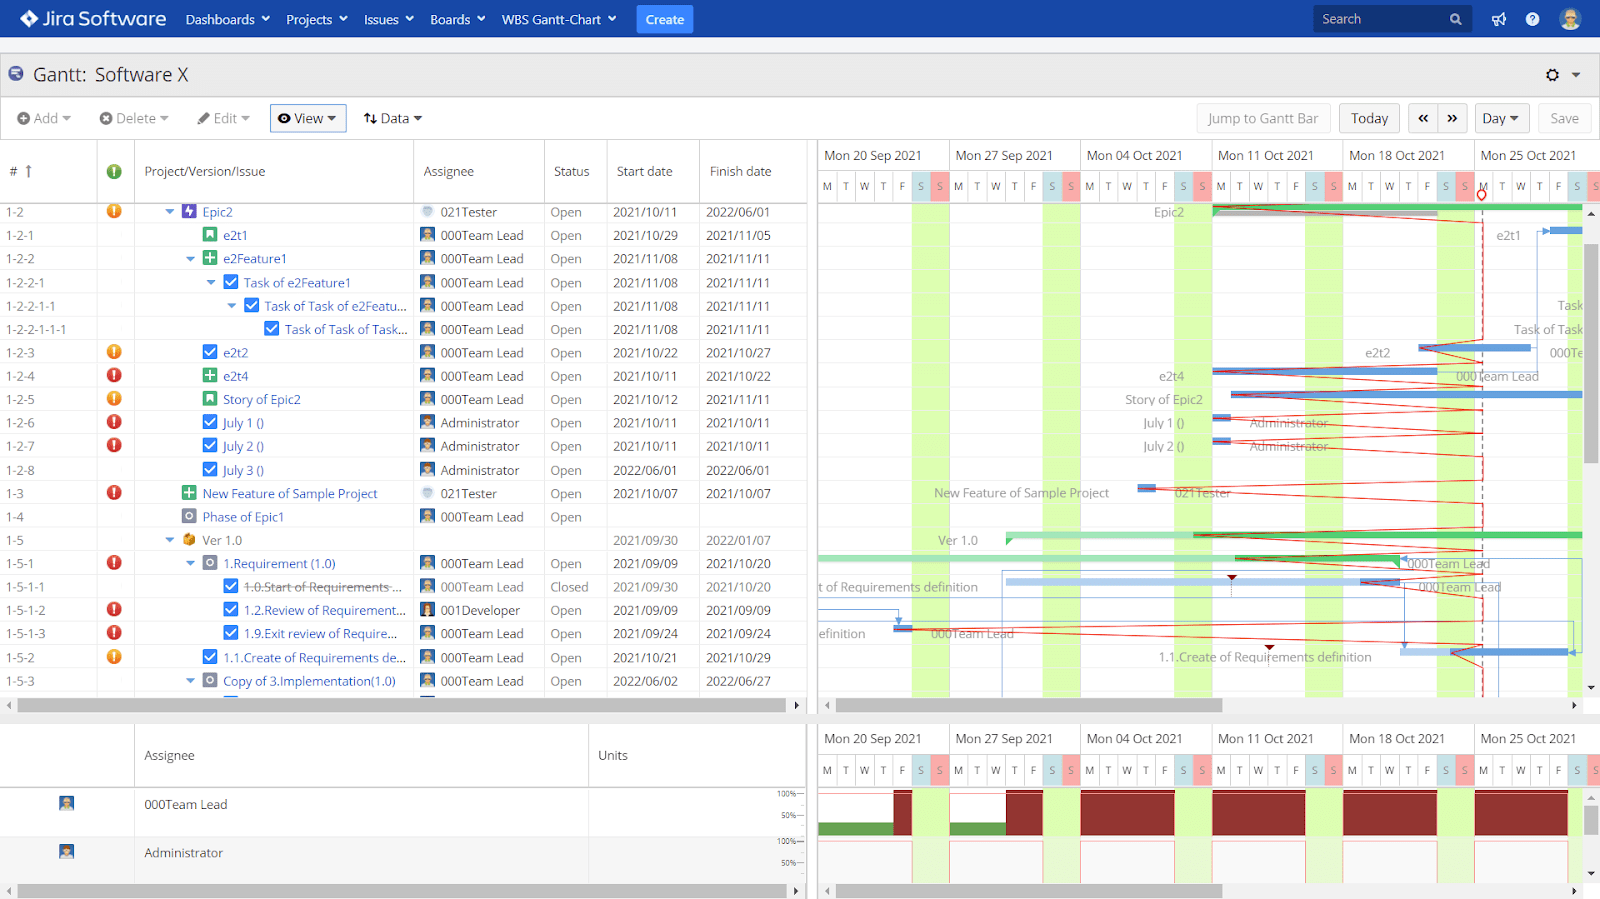
Creating from a project is easy — just find the project you want to chart using the app and it automatically loads all the issues under the Gantt and displays the relevant data of the issues on the chart.
Now, how about the filters?
Well, the filter comes in handy when you want to create a chart for multiple projects or for a subset of issues from one or more projects. Here’s where the true measure of flexibility in project planning is tested.
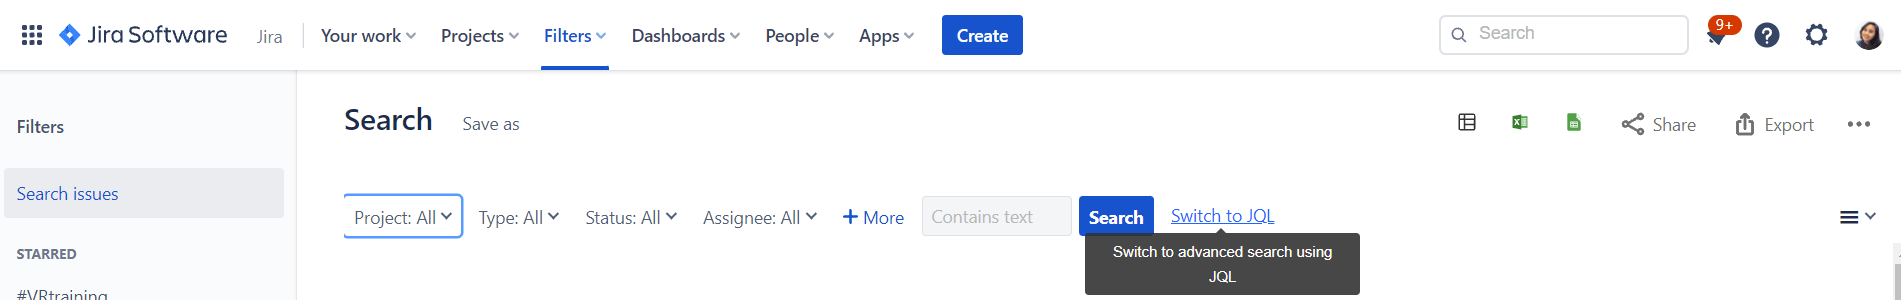
Jira Query Language (JQL) is a key feature in using the filter; it allows for advanced search capabilities and enables you to create a filter so that you can pull issues of particular criteria or status onto a single screen.
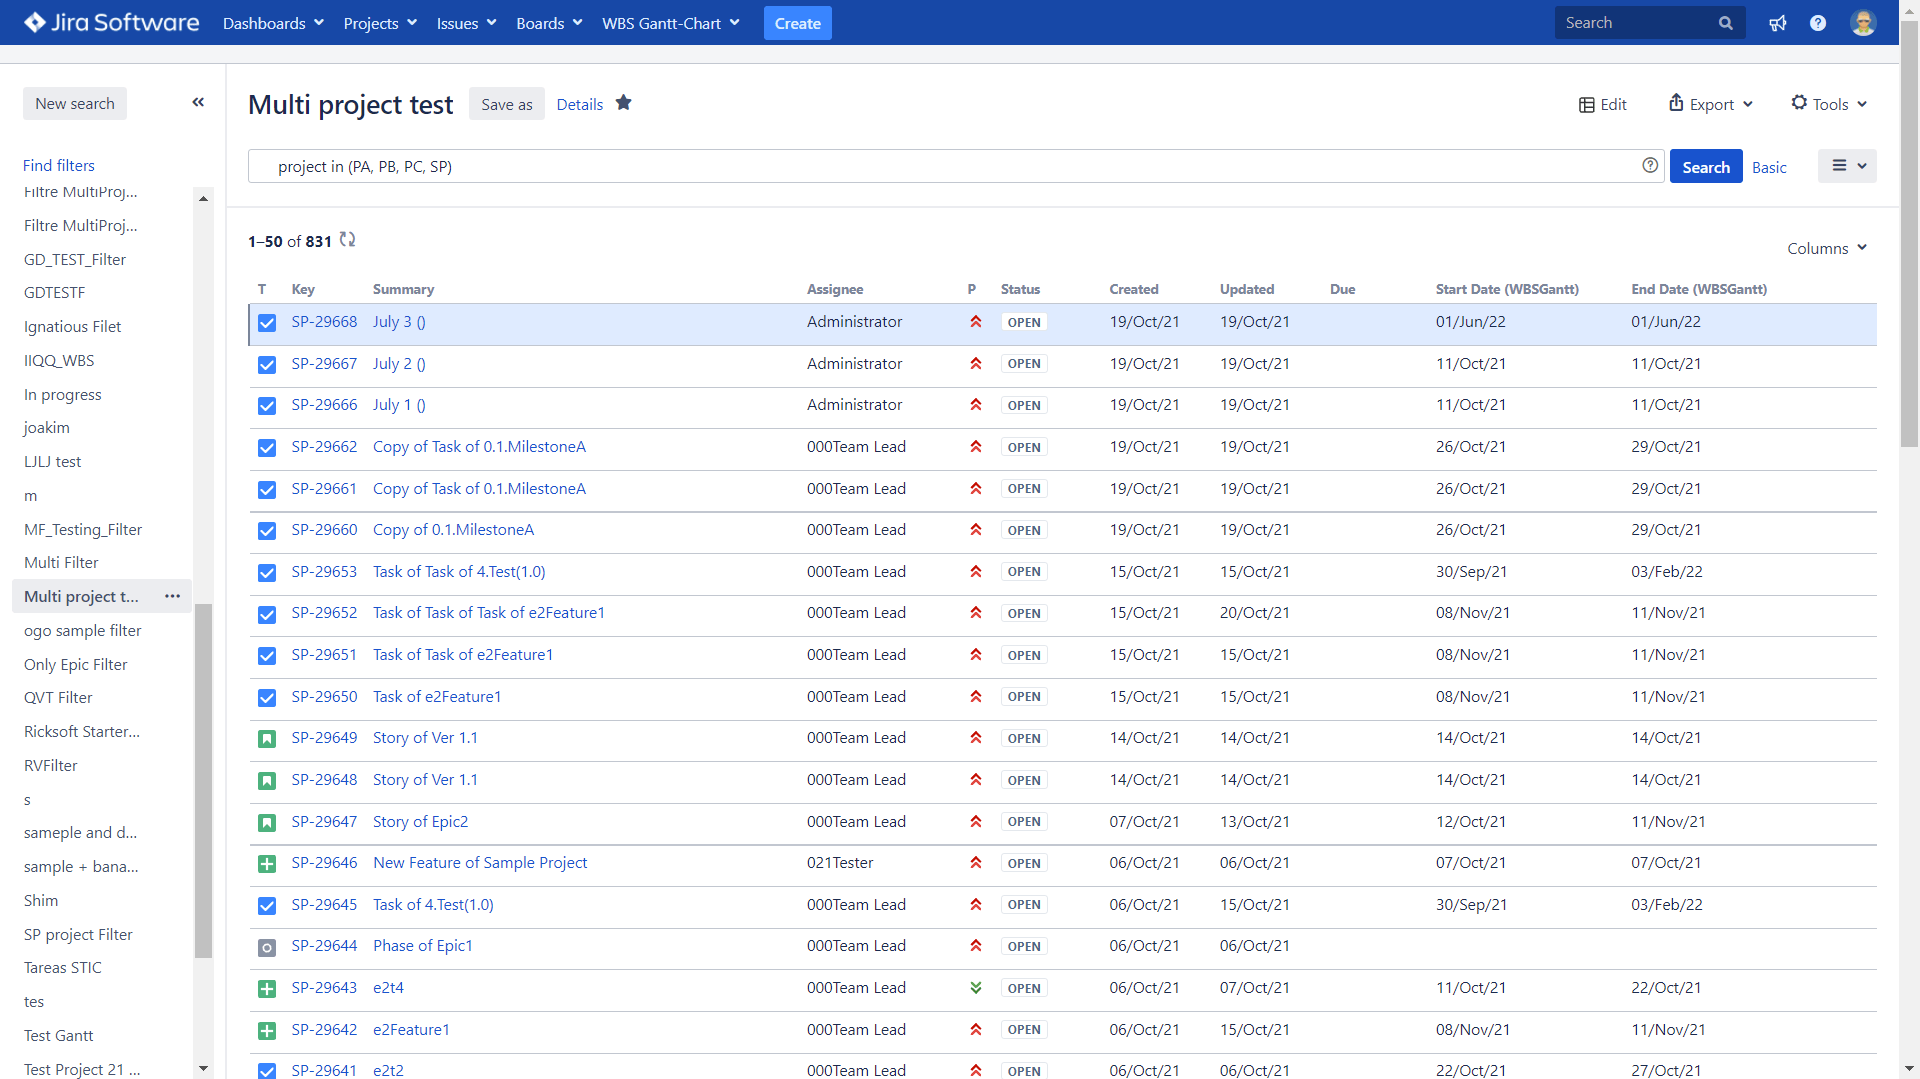
So, to create a chart from a filter, you must first create and save a filter using the Issue Navigator Screen.
You can use this filter to then create a Gantt chart. This is a sample of a filter used to filter issues for multiple projects. When you can manage multiple projects in a single screen, you can build your project portfolio management skills. This would also help you allocate better resources for all projects you manage.
However, the search parameters in Jira are still very much limited – even with JQL. It can’t meet very specific search needs, which then stunts your ability to plan, schedule, edit, and manage specific subsets of issues from one or multiple projects.
The ability to search effectively for very specific issues can literally save you hours of work in Jira. Despite being deemed the “Advanced Search” feature, basic JQL still can’t help you find issues with specific data categories.
For instance, you can’t specifically search for high priority issues that are blocking a project using basic JQL. The JQL Search Extensions for Jira app, however, removes this limitation completely using the following query:
issue in linkedIssuesOfQuery("project = TEMPO AND priority = Highest", "is blocked by")
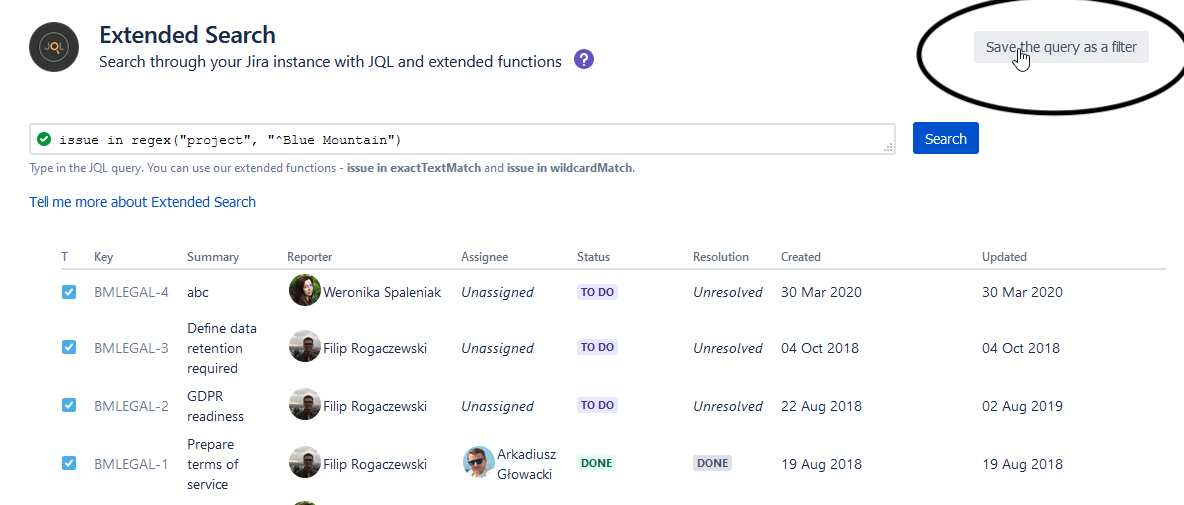
With over 50 search extensions, you can easily expand your search queries and find the data you need instantaneously. Overcome Jira’s search parameters limitations and effectively search throughout your instance.
You can save the filters you create using JQL Search Extensions to generate Jira dashboard reports, enable team members to quickly search for important issues, keep track of project versions, improve flexibility or project planning, and boost general productivity.
How can JQL Search Extensions heighten your use of the Gantt chart?
Let’s say you want to build a chart made up of
Then, JQL Search Extensions would come in handy. Users can save a filter using the app and then search for the filter on WGC when they want to create a new chart.
It’s important for PMs to have the ability to manage subsets of issues across multiple projects to make sure all blockers are identified and resolved in time.
Users can also include specific search queries enabled by the app when they want to configure Gantt quick filter settings. Create a new color setting for a chart by plugging in your saved filters that are enabled by the Search Extensions app.
So, let’s say you’re not creating a chart from a filter; you can still use a JQL filter when you want to customize the color settings so that only specific types of issues are affected by the configuration.
Your road to project planning excellence shouldn’t be stunted by the lack of Gantt chart solutions as well as extensive issue search capabilities. Try the WBS Gantt-Chart and JQL Search Extensions apps today.
This is a guest post written by Daniel Turczański, a software engineer and entrepreneur with over ten years of experience working on agile projects and software development using Scala, Java, JVM, and Open Source technologies. His in-depth understanding of Jira’s limitations and users’ needs has helped him in developing an app as comprehensive as JQL Search Extensions. He is now a Co-Founder at Digital Toucan, an Atlassian Marketplace vendor, and Atlassian Gold Partner.