Project Management

Sep 29, 2022 • 6 min read

In This Blog
Data-driven approaches are becoming increasingly common and essential for modern-day project managers (PMs). For instance, data analytics can help PMs better understand the internal workings of their projects, allowing them to identify top performers and any inefficiencies. Likewise, data visualization can provide new perspectives that shed light on previously missed connections, something especially useful during reporting.
Unfortunately, for PMs who rely solely upon Jira, the sentiment that Jira’s analytical and visualization capabilities are inefficient and simplistic is pervasive. This often forces PMs to look beyond Jira for a solution, but this itself causes further issues.
That said, while native Jira lacks the sheer functionality of alternatives like Excel and Power BI, Jira’s potential can be realized with the right plugins.
Power BI and Excel dominate the market when it comes to anything data-related. Excel alone serves over 750 million users, while PowerBI has been embraced by over 5 million. So, unsurprisingly, it’s often seen as a Jira alternative. Here’s why this is the case:
Excel and PowerBI offer a vast array of analytical tools that are fully capable of handling calculations of any complexity. From investment banking to literally rocket science, the sky truly is the limit here.
Excel, in particular, excels thanks to its thousands upon thousands of in-built formulas that cover from the humble SUM to the more complex CONCATENATE. Likewise, PowerBI, with its ability to connect together countless datasets while offering automated queries on top of data exploration, speaks for itself.
It wouldn’t be a stretch to claim that visualizing and organizing data is a game changer for PMs. When done right, spreadsheets can efficiently convert swathes of indecipherable data into something digestible. Moreover, graphs and other visualizations can add a further dimension of understandability for everyone involved, stakeholders, and team members.
Accordingly, both PowerBI and Excel are well-known for this. PowerBI offers some of the best visualization capabilities that readily breathe life to datasets thanks to its intuitive UI. Excel, too, provides a huge degree of flexibility when it comes to creating graphs and charts.
With PowerBI and Excel, users get practically everything done for them on their doorsteps. So whether you’re whipping up a line graph or trying to create a financial forecast for the upcoming year, you can rest easy knowing that you’ll never have to Alt + Tab.
To get around Jira’s lack of in-depth analysis and visualization tools, PMs often try using Jira in addition to Excel or PowerBI. This can be problematic because:
For teams, and larger ones in particular, it is crucial to ensure that everyone involved in a project gets the same information and stays on the same page. This is also particularly true when teams rely on multiple apps, which can diminish any project’s single source of truth (SSOT)— the practice of ensuring that everything can be found within a single location. Consequently, when using different apps, tracking information becomes tricky as information is not all stored in one place, leading to confusion and disconnected data.
The adage too many chefs spoil the broth holds true in project management. Having too many apps and constantly switching between them is a well-known contributor to errors in project management. Unsurprisingly, this tends to occur when PMs use additional apps in addition to Jira. Moreover, with multiple apps, the risk of accidentally duplicating work and overlooking key messages is increased according to research conducted by Asana.
A PM’s time is precious. So precious, in fact, that good PMs are always looking for ways to cut down on time-consuming tasks. One such timekiller can be attributed to switching between apps. Though this may seem harmless at first, for PMs who constantly switch apps, this time spent slowly adds up, ultimately taking a heavy toll on productivity.
Despite PowerBI and Excel’s advantages, what makes Jira worth its perceived inconveniences is that it was built for project management from the ground up. Jira may not be perfect, but it certainly is worth its weight in gold.
To get around the myth that Jira can’t perform in-depth data analytics, integrating Excel with Jira is the next logical step. This is where Excel-like Tables for Jira makes its awaited entrance.
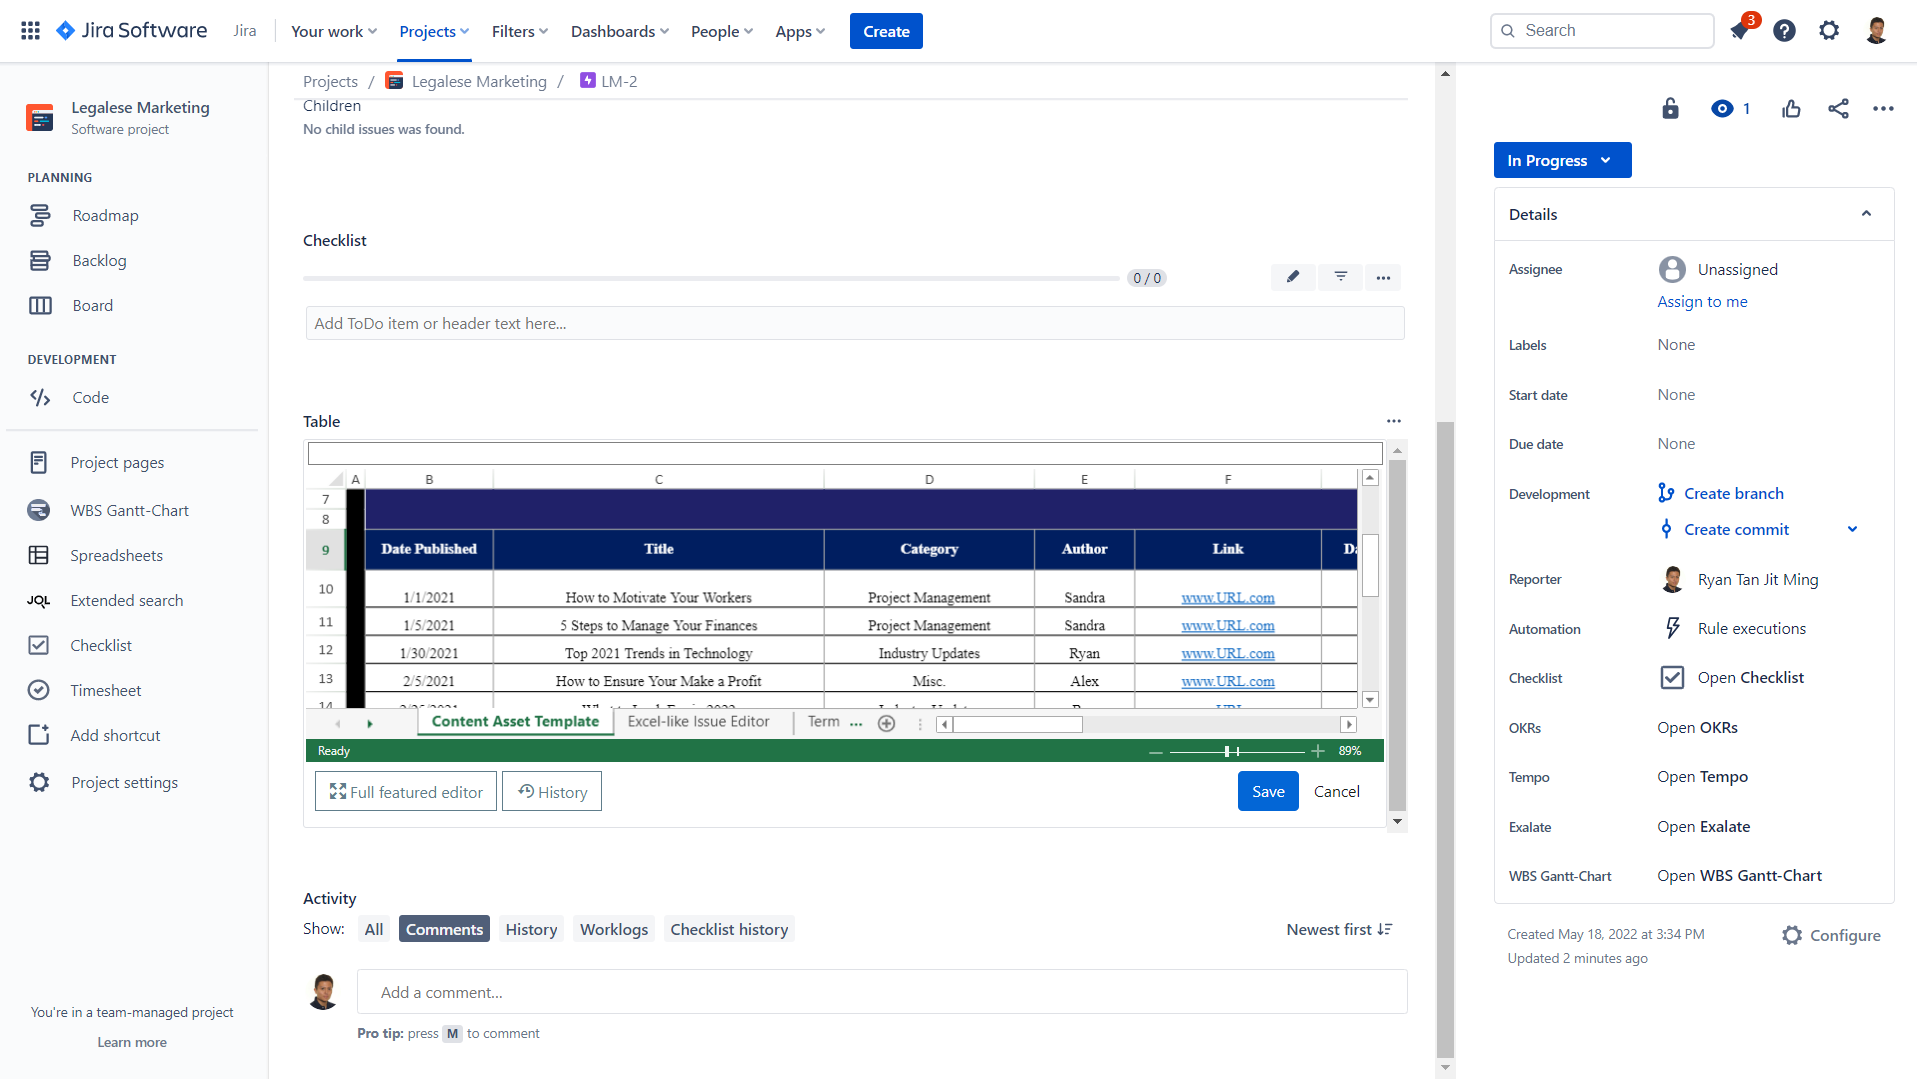
Excel-like Tables for Jira combines Jira and Excel together, allowing PMs to harness Excel’s powerful functions without needing to switch out as an Excel-Jira integrator. In practice, this also helps PMs avoid the issues mentioned above.
PMs will now be able to take full advantage of Excel’s vast arsenal of analytical and visualization tools. For example, PMs can create spreadsheets with thousands of entries and quickly convert them into any type of graph or chart in Jira. Now, whether it’s a histogram, scatter plot, bubble chart, or even treemap chart, nothing is off the table. And of course, this is all achievable within the Jira ecosystem.
On top of this, Ricksoft’s solution also includes a number of useful features that go beyond analytics. With Excel-like Tables for Jira, PMs can also set group permissions to exert tight control over who can access and edit issues which is a particularly helpful feature for PMs dealing with sensitive data (e.g. medical records).
Jira indeed falls short due to its lack of analytical capabilities. But with a little help from add-ons, it doesn’t have to be like this.
The best way to get a feel for what we’ve covered above is to see it for yourself. Try out Excel-like Tables for Jira today!