Project Management

Nov 19, 2021 • 6 min read

In This Blog
Project monitoring is a critical process throughout your project execution. Monitoring requires project managers to stay on top of their project from start to end so that potential blockers and risks are identified in a timely manner.
When you can monitor your project successfully, you can control its outcome and stay aligned with your project plan.
Now, monitoring can be a laborious process because you have to be able to track the progress of your project, which is hard to do without some form of tracking and automation capabilities. Not to mention, you need to consistently compare your current progress against your initial plan to justify performance to stakeholders, which means reporting capabilities are needed.
You can find these basic capabilities in Jira via its dashboard. It’s customizable, displays a range of project data, and can help teams be more data-driven. More importantly, it can be leveraged by any team member as a personal tracking system.
In this article, you’ll briefly learn about Jira dashboard, ways to customize it to support monitoring, and a powerful tool that you can deploy to supercharge not only monitoring but also project control.
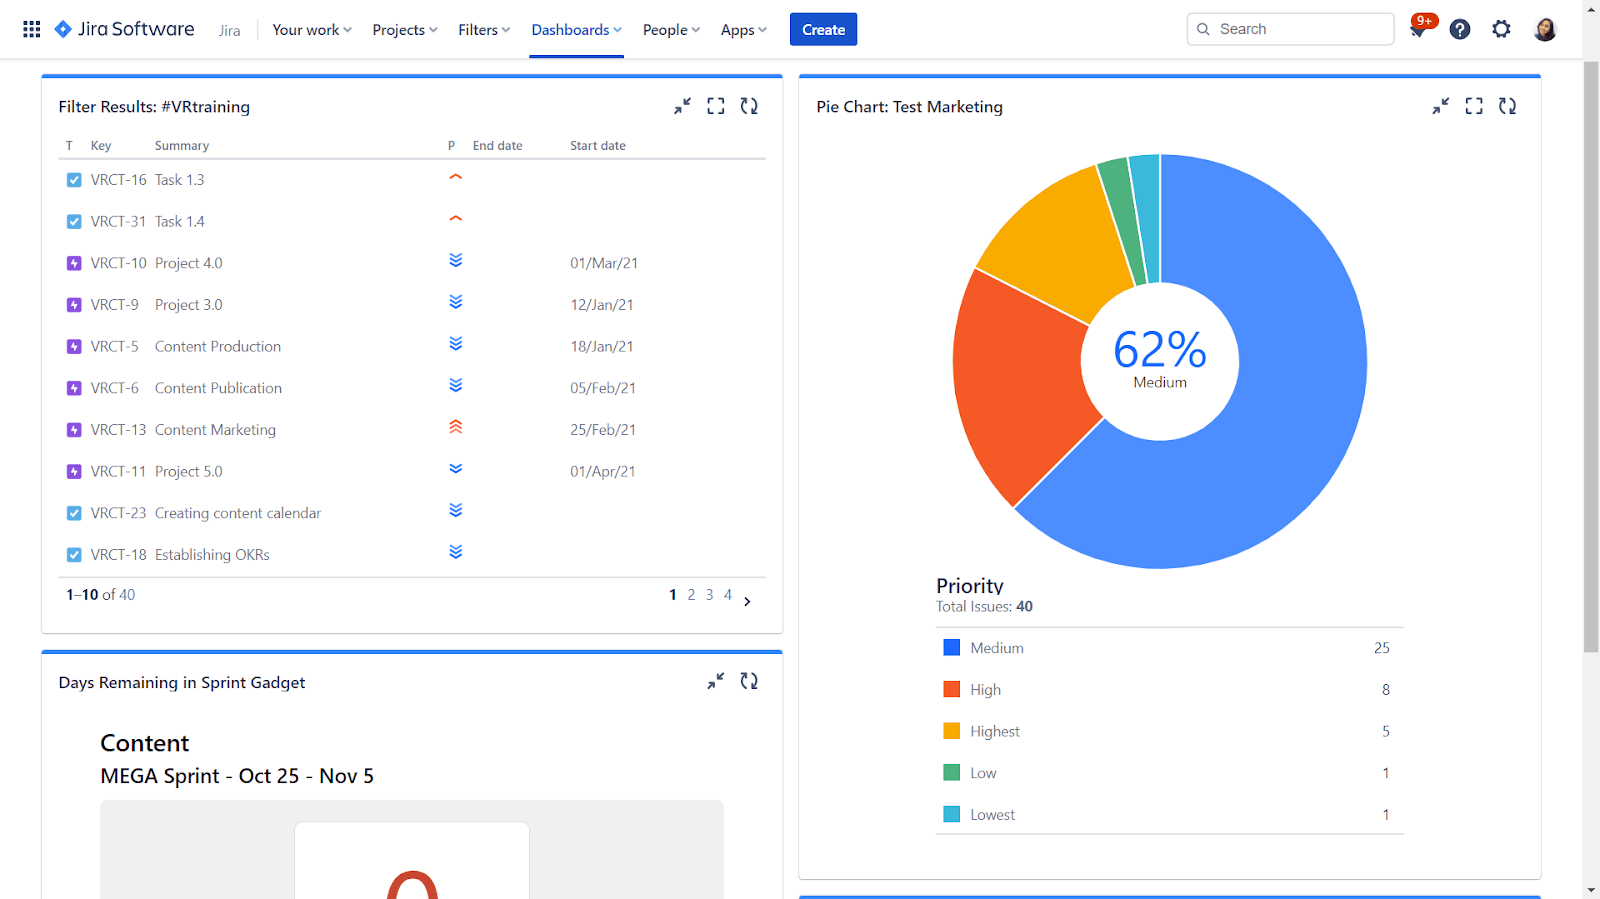
Jira’s dashboard is the default view for users when they go to the platform’s homepage. It offers an interactive overview of what you and your teams are working on – either for one project or more – without anyone having to switch back and forth between project screens.
You want to have a quick glance at your project progress? Want to know how many issues are pending to be resolved for this sprint? Want to look at the status of specific issues? Go to your dashboard!
The system dashboard is the one set up by your Jira admin and is visible to everyone with the viewing permission. However, each user can also set up their own dashboard that’s only visible to them – one dedicated to their name under the ‘Dashboards’ menu.
There are three elements of the dashboard that are customizable to make this possible.
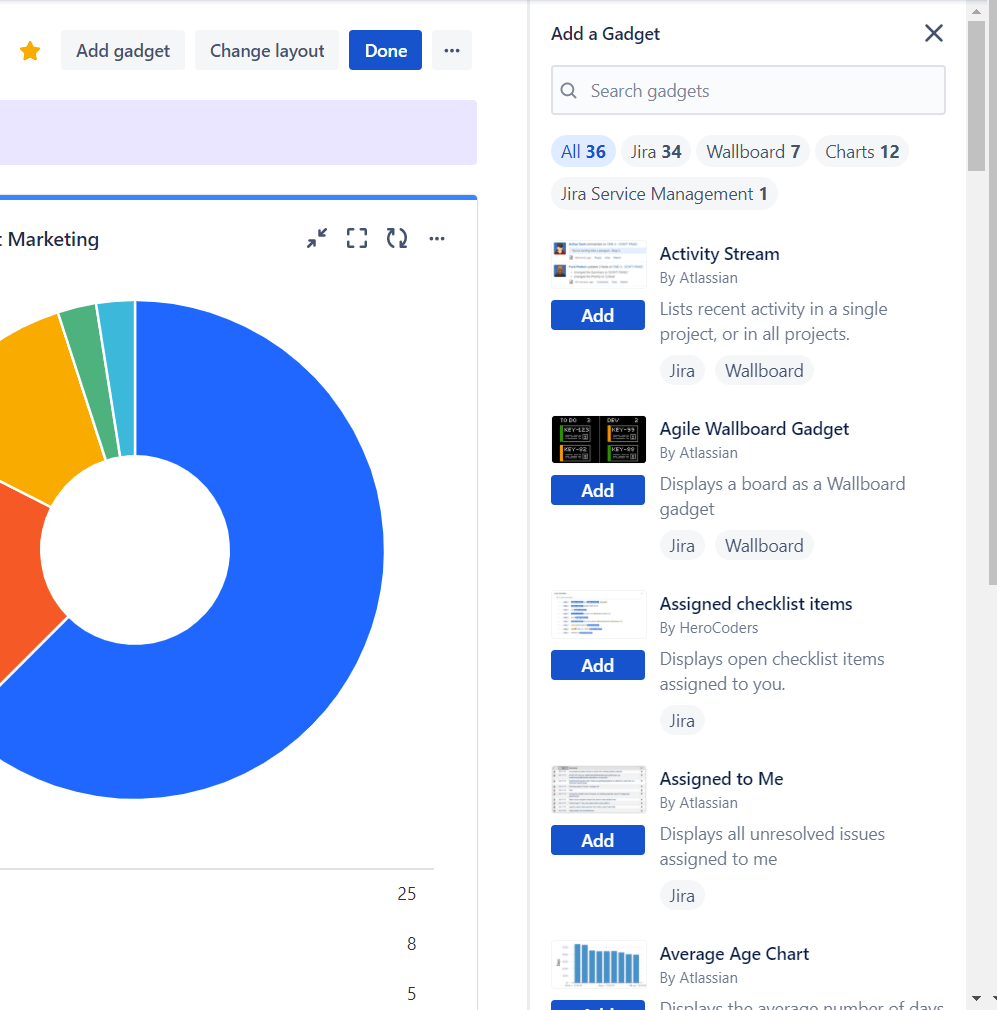
Below is an example of a marketing project manager’s dashboard. The number and types of gadgets displayed may vary for different teams.
So how do you set up your dashboard for project monitoring?
Here are some steps you can take when customizing your dashboard.
When monitoring, you want to be able to benchmark your current progress against your initial plan. There are many ways to do this, but some key data you need to assess include:
Keep the parameters above in mind when choosing your gadget. While the gadgets will not be able to display data like baseline, resource allocation and dependencies, you can still consider the following:
It’s important that you configure each of your gadgets so that the right issue or project data is displayed. Especially gadgets that allow you to filter your data results using JQL; create a filter beforehand using the Jira Advanced Issue Navigator screen.
You should also set the frequency for data updates for the gadgets you choose. Not all gadgets have this option, but for those that do, set how frequently you want the data to be refreshed.
While the dashboard is helpful, there’s an app that you can use to improve the entire monitoring process and help display data that the dashboard can’t.
Project monitoring is a tricky process that can take a lifetime to learn. To help you on your journey, check out our Jira Project Monitoring and Control: A Comprehensive Guide e-book!
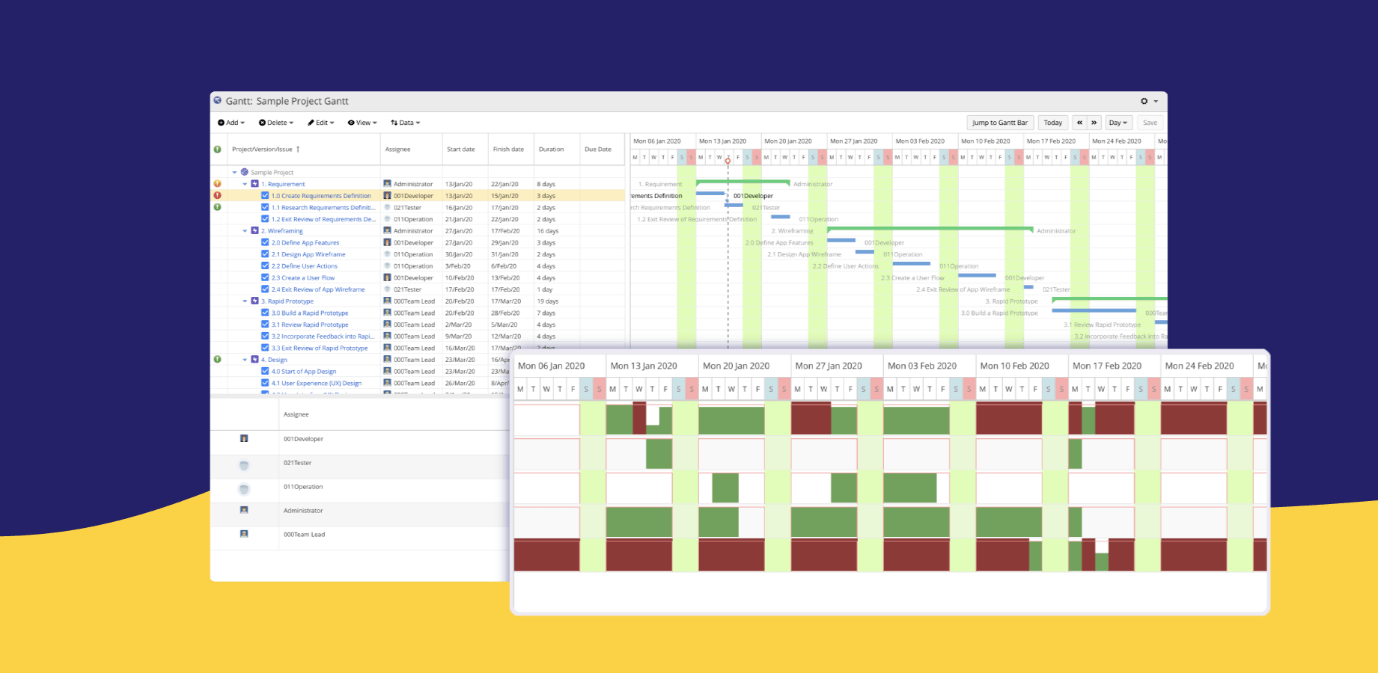
One of the most substantial tools in project monitoring is a Gantt chart – which isn’t available in Jira’s native environment.
A Gantt chart not only enables extensive monitoring, but also efficient controlling. WBS Gantt-Chart for Jira helps display critical project data in one screen, allowing you to track project progress against the project baseline.
View your critical path, dependencies, start and end dates, progress line, and issue status all in one screen.
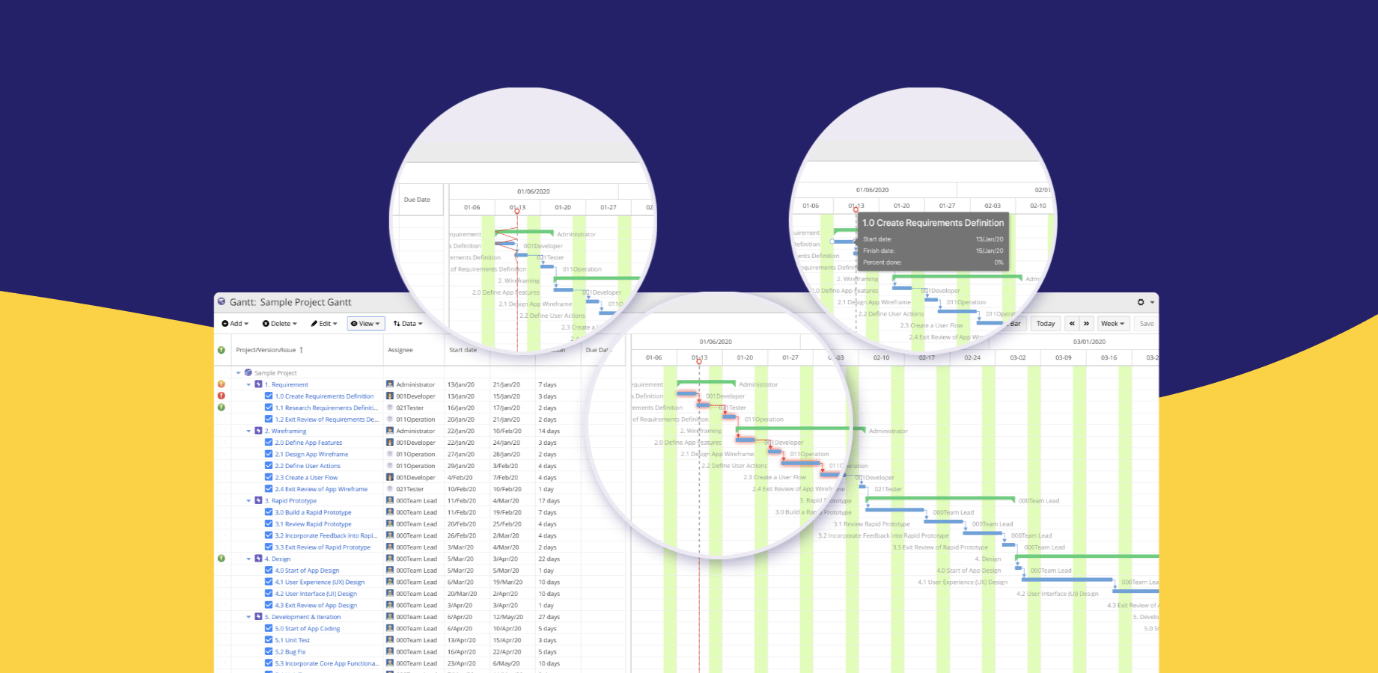
The app will warn you if an issue is overdue, reaching its starting date, or has passed its start date, helping you stay on track more proactively. On top of that, you can also view your resource availability and distribution, allowing you to manage your teammates’ workload more efficiently.
The app doesn’t just simply project monitoring and control; it also accelerates your planning and execution.
It pays to invest in capabilities that boost your chances of completing a project successfully. Try WBS Gantt-Chart for Jira for free today. Additionally, read our detailed guide and e-book to boost your current skill set!