News

Jun 5, 2018 • 4 min read
Topic
Author
In This Blog
“If the Gantt bar was a bit thicker, it would be easier to see. That would really help when I was doing a report.”
“We don’t use a baseline, so it would be great if I could increase the area of the Gantt bar where the baseline would normally be.”
We’ve had a lot of feedback and requests like this, so we’ve added a function to make the Gantt bar for your plan thicker by hiding the baseline bar.
To understand what we’ve done you need to see what the change looks like. Take a look at these screenshots to start with.
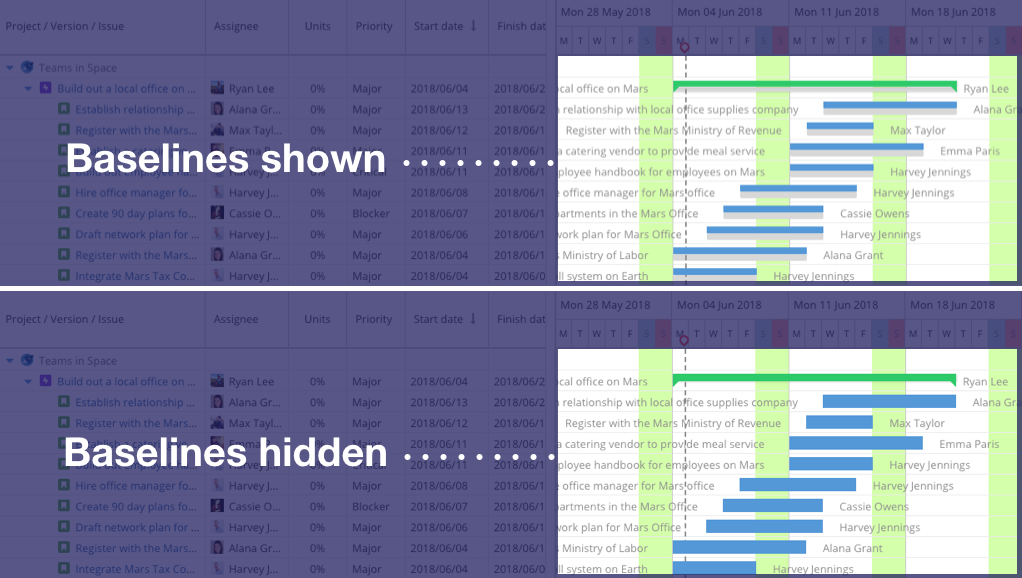
What do you think of that? We reckon the plan is much easier to visualize if you don’t show the baseline. If you’re not using the baseline function or if you’re making a report when you create your plan, you can use this function as you need by turning the display of the baseline bar to OFF.
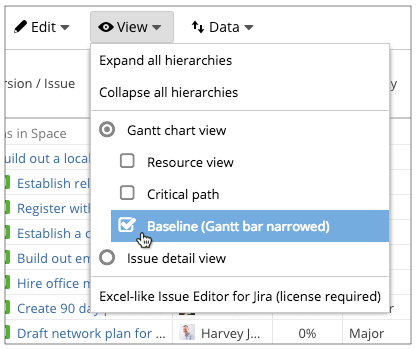
It’s easy to switch the baseline between Display / Hide on the View menu on the operations bar, so you should give it a go!
Reduced wait time for page display to load with certain data
Previously with WBS Gantt-Chart for Jira, the software’s performance sometimes deteriorated depending on the data displayed and the sort order. It often took longer for the display to load than you’d have expected.
In Version 9.6, we’ve solved this problem. We’ve improved the processing speed so performance is much more consistent.
Whether you can see the difference in wait time will depend on the actual data you’re displaying and the sort order, but we think many of you will see a noticeable improvement.
By the way, up to Version 9.5.x, this performance deterioration was especially obvious if there were many issues later on in the project (in the lower part of the screen) that did not have their start and end dates input, even if the issues early on in the project (at the top of screen) had their start and end dates filled in.
This tended to happen if only the WBS had been created, and the plan for the second half of the project had yet to be decided. If this is the kind of data you look at a lot we suggest you update to 9.6 !
Now it’s easier to use the issue detail view
We’ve also made it easier to use the issue detail view function, first rolled out with WBS Gantt-Chart for Jira 9.5.
To switch straight to issue detail view mode all you need to do is click on the target issue name on the WBS. The issue detail view is displayed on the right hand side.
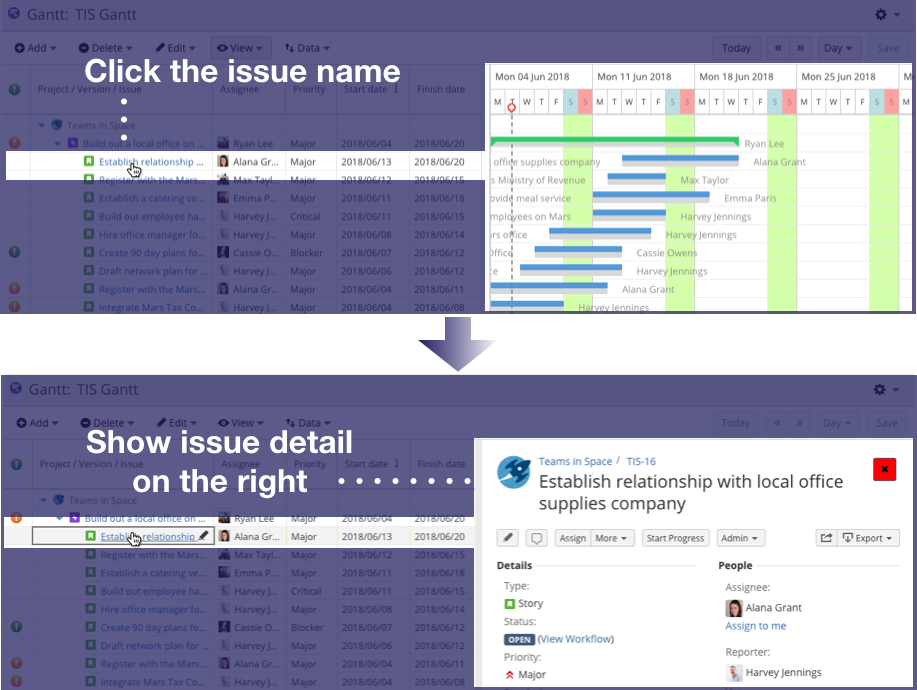
This improvement makes it easier to use the issue detail view function than in 9.5.x.
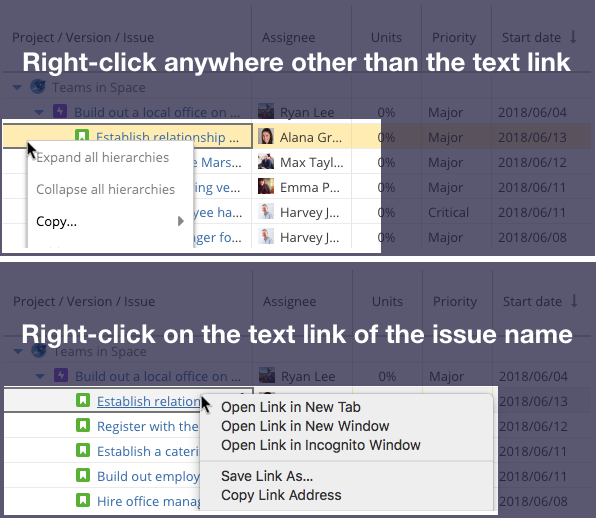
We’ve made a change so that the standard browser menu is displayed if you right-click on the text link of the issue name. This is in order to leave space for displaying the issue detail view on a separate tab as before. Existing users take care!
If you right-click anywhere other than on the text link, the usual WBS Gantt-Chart for Jira menu is displayed as before.
And finally…
We’ve made a few other minor improvements and fixed some bugs. Please check the release notes for details.
You can download and install WBS Gantt-Chart for Jira 9.6 from the link below. A 30-day trial license is available, so please give this a try!
or upgrade WBS Gantt-Chart for Jira
#wbsganttchart #projectmanagement
