News

Aug 30, 2017 • 5 min read

In This Blog
Today we released Version 9.2 of WBS Gantt-Chart for JIRA. This is the third major version of our flagship project management tool this year.
Before we tell you about what’s in Version 9.2, let’s take a look back at previous versions of the add-on.
Version 9.0 featured the new ‘Gantt’ function, enabling Gantt charts to be created at project manager level (without requiring JIRA administrator authority).
In Version 9.1, we rolled out several new features that were similar to Microsoft Project. This was because many of our users have migrated from Project, and a lot of them had asked us to make WBS Gantt-Chart more Microsoft Project friendly.
Focusing on improving the UI
Even though this is Version 9.2, we wanted to make the user interface so easy that even first-time users would have no problems getting the hang of it. We designed it to be as simple and easy to understand as possible.
However, that’s not to say we’re not going to keep working to improve the design.
As we’ve learned from Atlassian, “It’s a marathon, not a sprint” when it comes to fine-tuning our software, so we’ll keep thinking about ways in which to improve the user interface and experience in future.
Revamping the operations toolbar
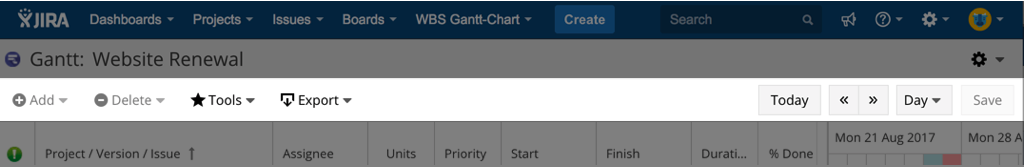
The key improvement in the user interface for Version 9.2 is the toolbar. The new WBS Gantt-Chart toolbar display has been redesigned as follows.
Previously WBS Gantt-Chart for JIRA’s toolbar featured a row of distinctive buttons lined up as icons across the screen without any words or labels. However, since there were no labels, new users or people who’d just installed the software for the first-time would look at it and think “What are all these buttons for?” or “What does this do?”
We admit it. It wasn’t always clear what the buttons meant. The feedback we got suggested some users struggled with knowing what function was attached to each icon. So in the new toolbar, most of buttons now have labels to identify their function.
It’s easier to see where each function is, and what happens if you click the button, even if you’re new to the product. So it’s a much more user friendly interface all round.
You can still display the contextual menus that you’re familiar with by right-clicking in WBS Gantt-Chart, but many menus are now directly accessible from the operations toolbar.
This means that if you are not in the habit of right-clicking when using applications on the web, you can still see at a glance how to create and delete tickets on the new toolbar.
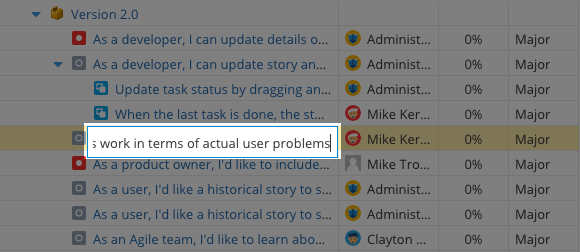
Changing ‘Start cell edit’ mode from single-click to double-click
Previously, you edited ticket or version information by single-clicking on the target cell.
In 9.2 we’ve changed this so that you double-click on the cell to edit. We’ve introduced a new feature, Select row, in our revamped toolbar, so we’ve made the change in order to differentiate between the two functions – you select a row with a single-click, and you start editing with a double-click.
Change of name – ‘tickets’ are now ‘issues’
In previous versions of WBS Gantt-Chart for JIRA, we’ve used the term ‘ticket’ for project tasks or software bugs. We’ve now changed the name to ‘issue’ so that we’re in line with the usage in JIRA.
New functions as well as an improved user interface
Using Sprint for ticket planned date fields
Now you can select JIRA software’s Sprint for the values you use to be used as ticket planned dates. Let’s say you want to show a Gantt bar for a plan using the dates in a sprint because you’re using the sprint to decide your plan.
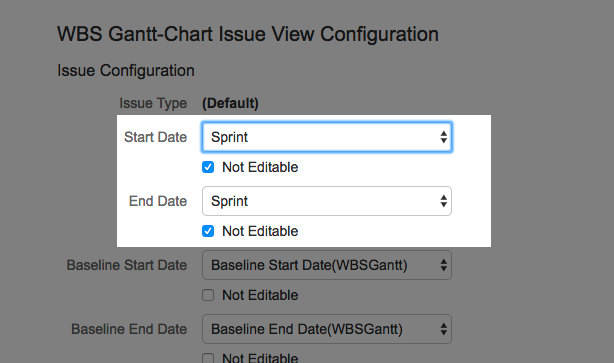
By specifying Sprint for both the start date and the end date of a ticket, the Gantt bar takes the corresponding start and end dates set from the sprint set for the issue and displays these accordingly.
Reversing linked issues for parent-child relationships and dependencies
We’ve added a function that lets you show linked issues in parent-child relationships and dependencies in the reverse direction to normal. To help you see what we mean by this, take a look at the diagram to see how the function works.
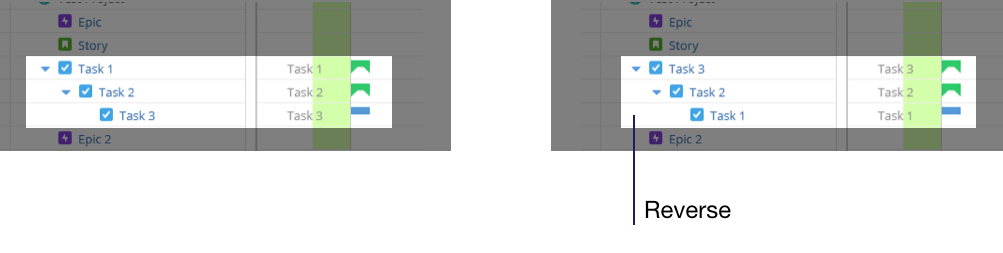
In the screen on the right you can see that the parent-child relationship is displayed in reverse, compared to the screen on the left.
You’d be forgiven for being a bit skeptical. “What’s the point of this function?” you might say. Well, here are two situations where you might find this really helpful.
For the first of these, we’ve seen this happen for ourselves when we’ve been using JIRA’s Redmine importer to import issues from Redmine.
Revamping our product logo
Some of you may have noticed that we’ve changed our logo on Atlassian Marketplace and on our website. We’ve also updated the WBS Gantt-Chart for JIRA product logo as well. We now have a purple-based design as our logo.
![]()
Summary
In Gantt-Chart for JIRA 9.2 we’ve incorporated additional features and fixed the bugs in the previous version. More detailed information can be found in the release notes.
#wbsganttchart
