News

Jul 7, 2020 • 4 min read
In This Blog
Our customers rely on the stability and functionality of WBS Gantt-Chart for Jira to deliver successful projects. So, it’s our number one priority to keep the system running smoothly. Below, I explain how Ricksoft uses Datadog to monitor events and measure our app performance in the cloud environment.
Datadog and similar platforms like New Relic use observability as a keyword. The platform provides a single view of the infrastructure. The term observability refers to incident diagnosis, whereas, when a problem occurs, the root cause can be identified and fixed immediately.
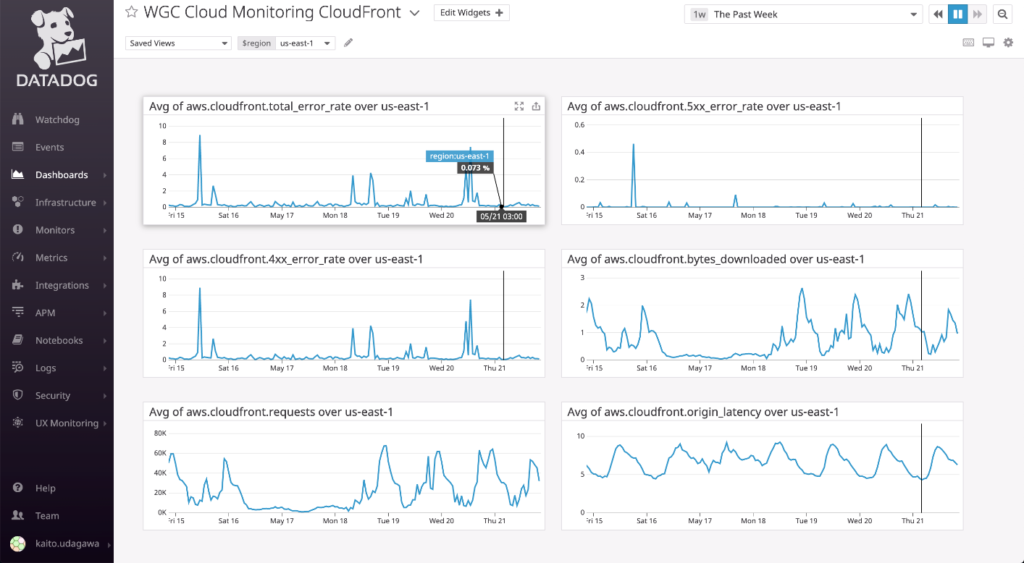
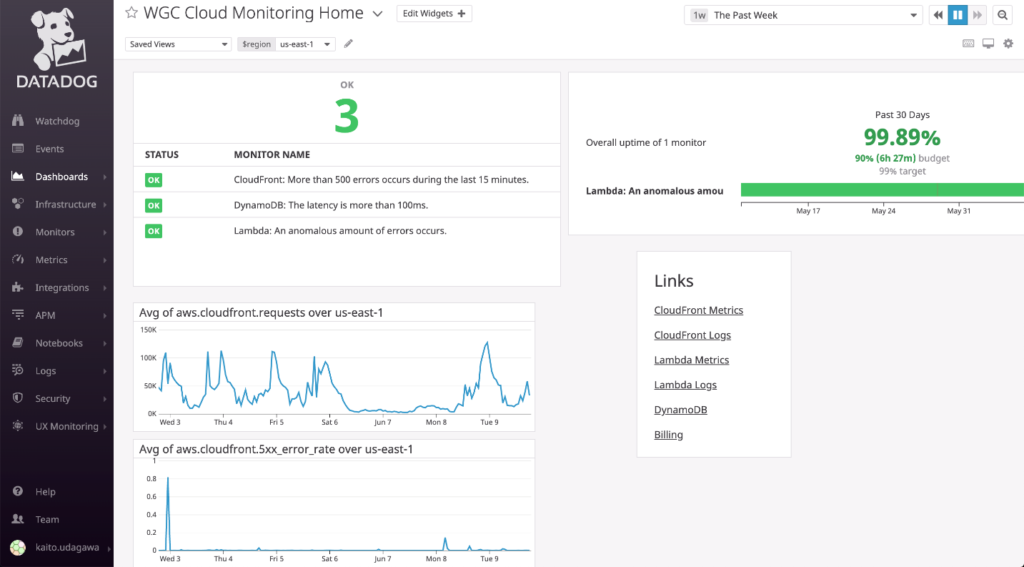
In this section, let’s go through the key metrics and logs that we measure through Datadog. Specifically, as a premise, WBS Gantt-Chart for Jira Cloud has a serverless architecture and uses CloudFront and Lambda, which I will explain more with the screenshots below.
The CloudFront metrics that can be acquired are mainly the number of requests and the error rate. From the figure below, notice the recorded accesses on Saturdays and Sundays and that errors in the 400s are constantly occurring.
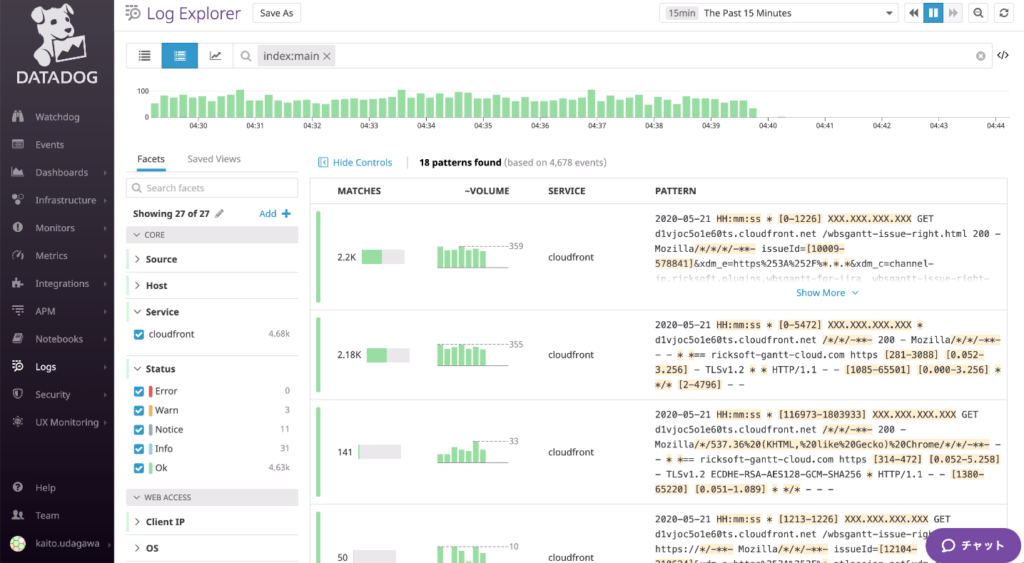
Originally stored in S3 buckets in a gz-compressed form, collecting CloudFront logs is quite difficult. Fortunately, we’re now able to visualize them easily using Datadog Logs, which are displayed statistically as you can see above. For instance, notice that more than half of the accesses are concentrated in /wbsgantt-issue-right.html.
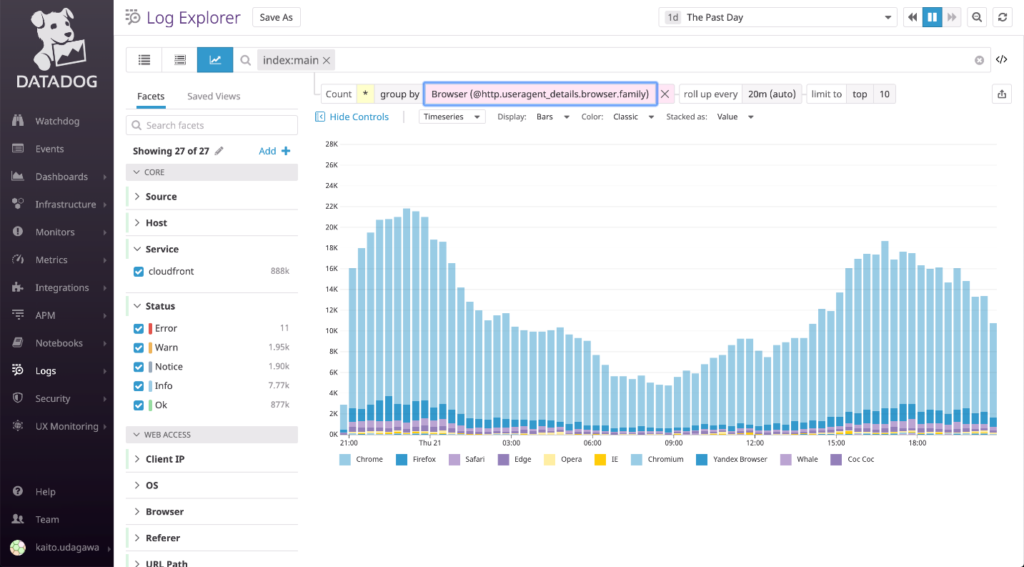
In this figure, we monitor the graph of browser type as revealed from the CloudFront log. With Datadog, it is also possible to visualize the log information as a graph in a similar way. The graph above tells us that most of the access is from Chrome, but there are some minor browsers that we should also pay attention to.
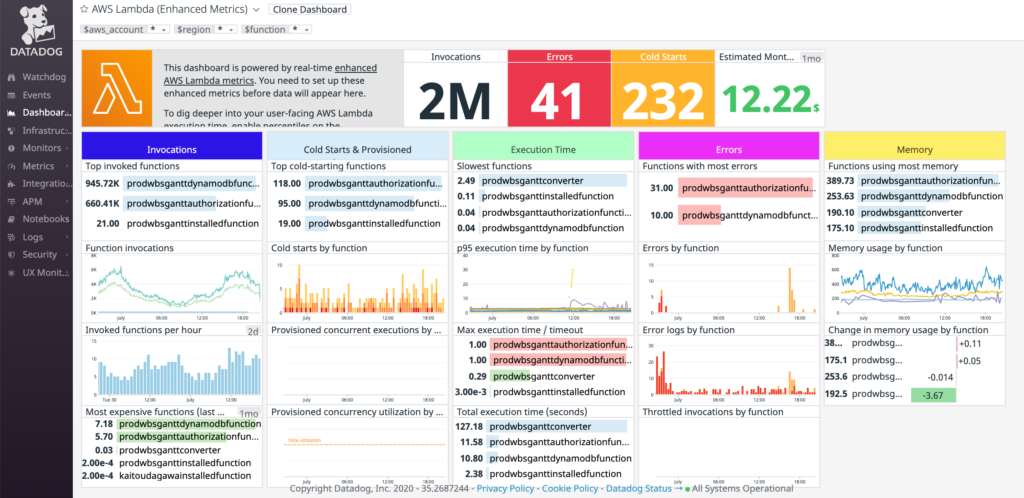
Now, let’s go through various Lambda metrics. The acquired metrics are mainly the number of times a function is called and the time it takes to call it. Based on the graph below, for example, you can see that the Converter function takes the longest to execute. With the log collection, we can also observe the usage of memory and the number of cold starts.
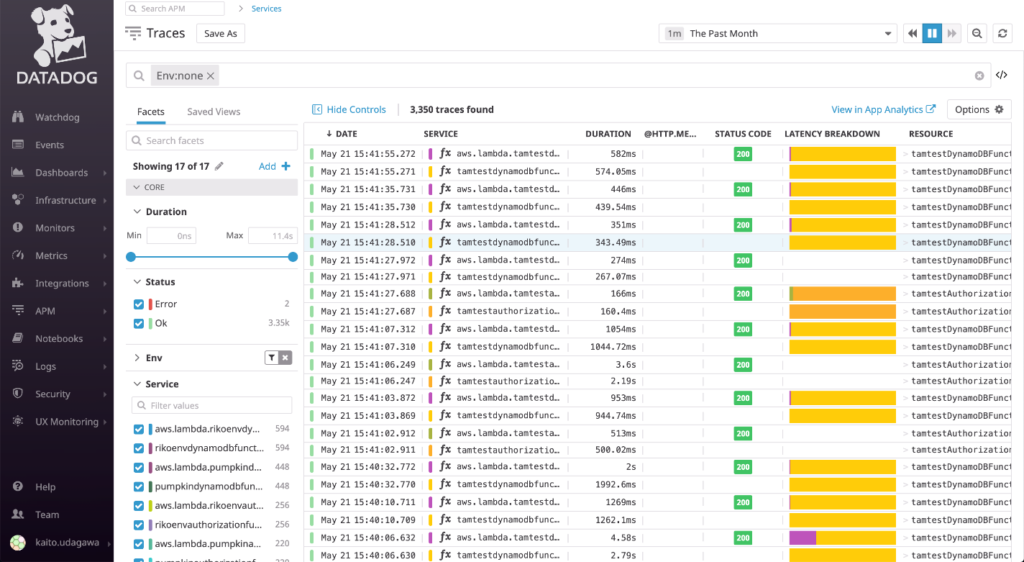
Here’s another key information – APM (Application Performance Monitoring) of Lambda, which indicates the execution time of each function. Also, when an error occurs, you can get the stack trace of it.
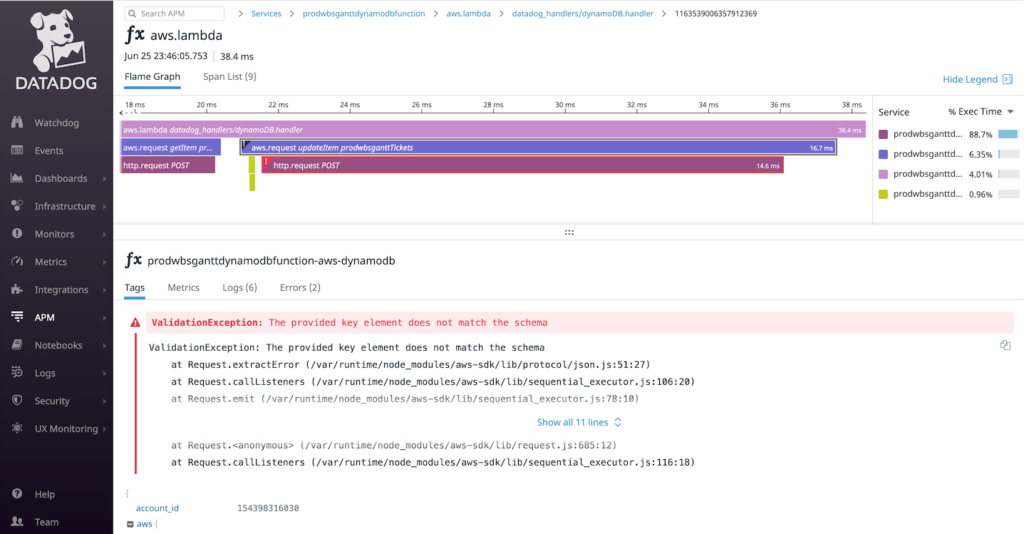
Here is an example of the stack trace. In AWS Lambda, it is difficult to tie errors and logs. However, by aggregating errors and logs to Datadog, it is very easy to identify the root cause of an error.
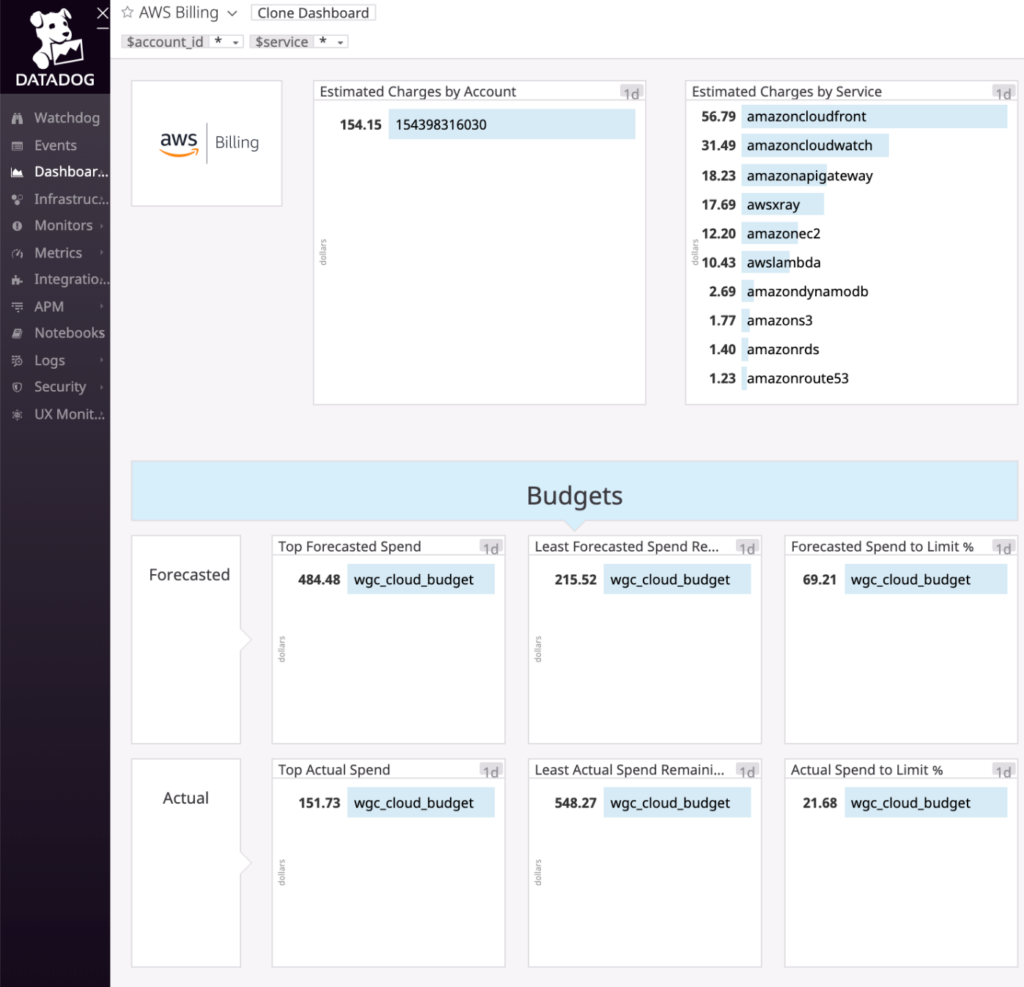
We can also track AWS payments information. As you can see, the estimated billing amount for each service has been captured. Also, we can accurately compute the consumed amount in a month, which is useful for verifying the actual usage of AWS.
The introduction of Datadog is a step towards increasing the reliability of our products. Next time, I will explain Statuspage, which is an incident management tool.
Author: Kaito Udagawa
