Topic
- Reporting & Data Visualization
Featured Apps
Table of Contents
Managing Financial Data Efficiently Is a Complex Task
Efficiently managing financial data across various tools can be a daunting challenge for teams. When multiple software are in play, tracking financial reports becomes much trickier and results in wasted time. While Confluence can address your collaborative needs, it lacks the inherent capabilities for financial report management, including spreadsheets and data visualization.
Embed Spreadsheets and Tables Directly onto Your Confluence Page
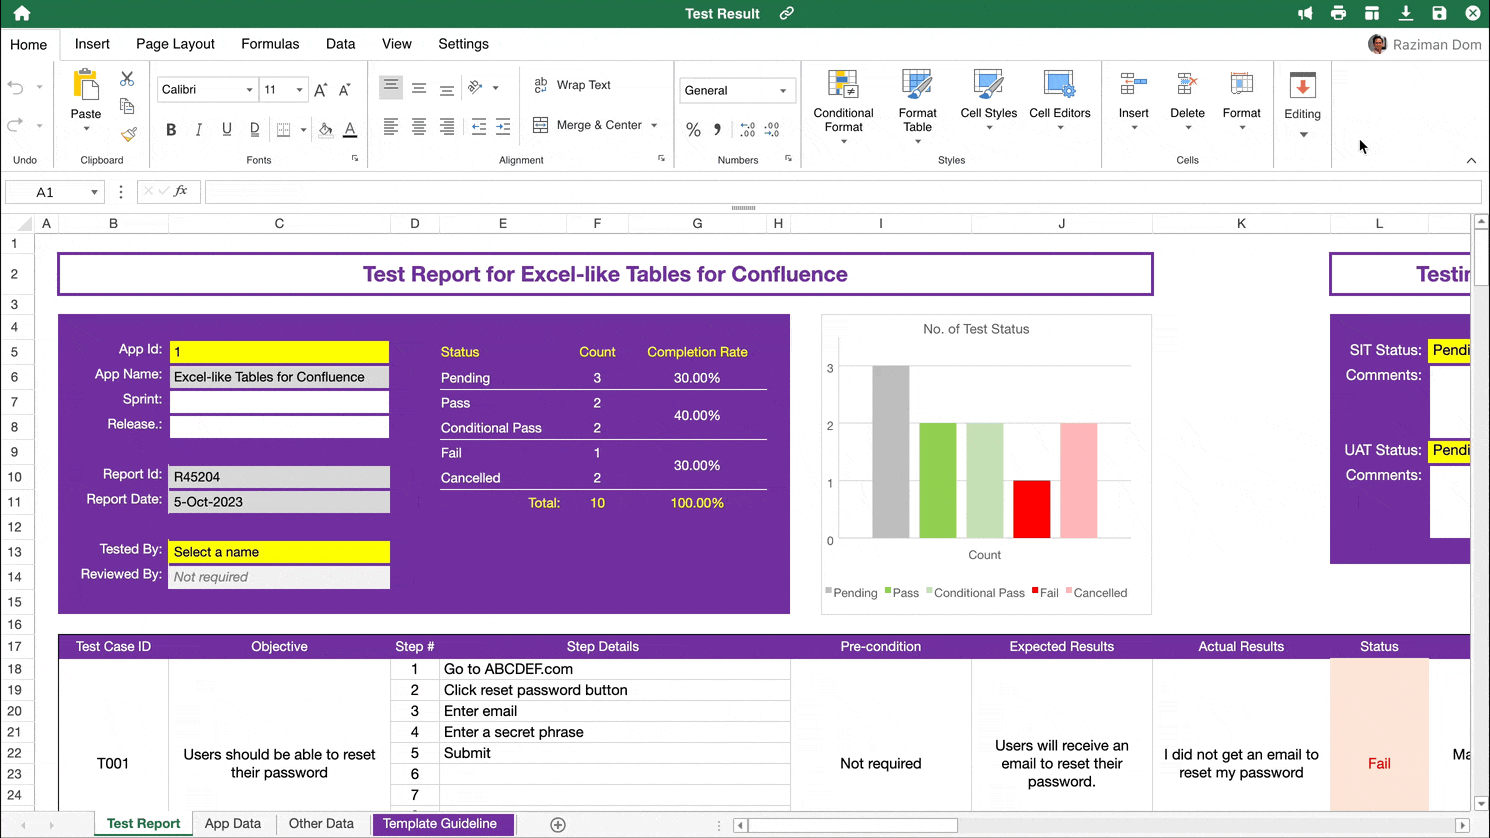
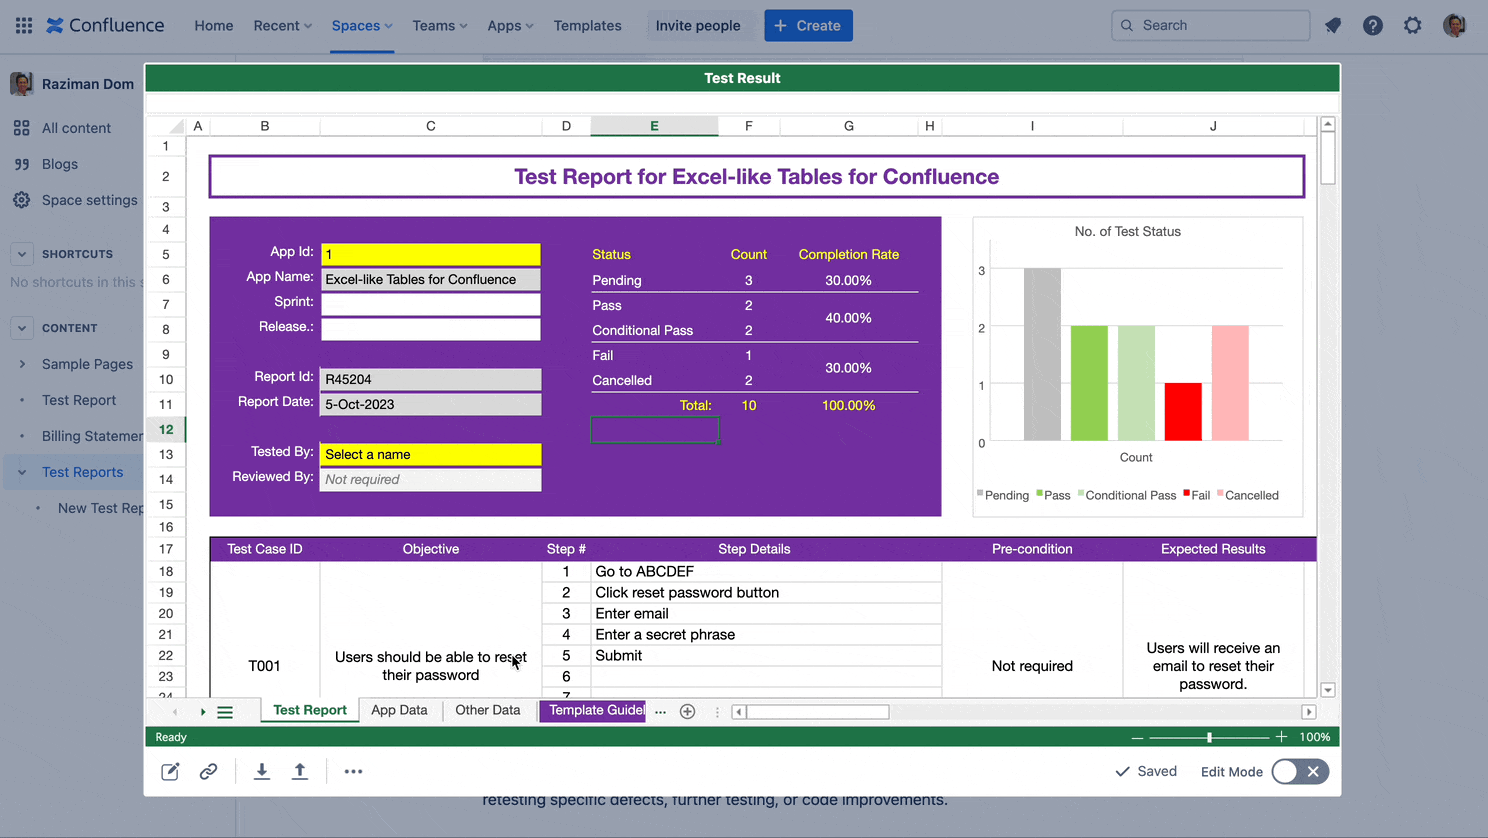
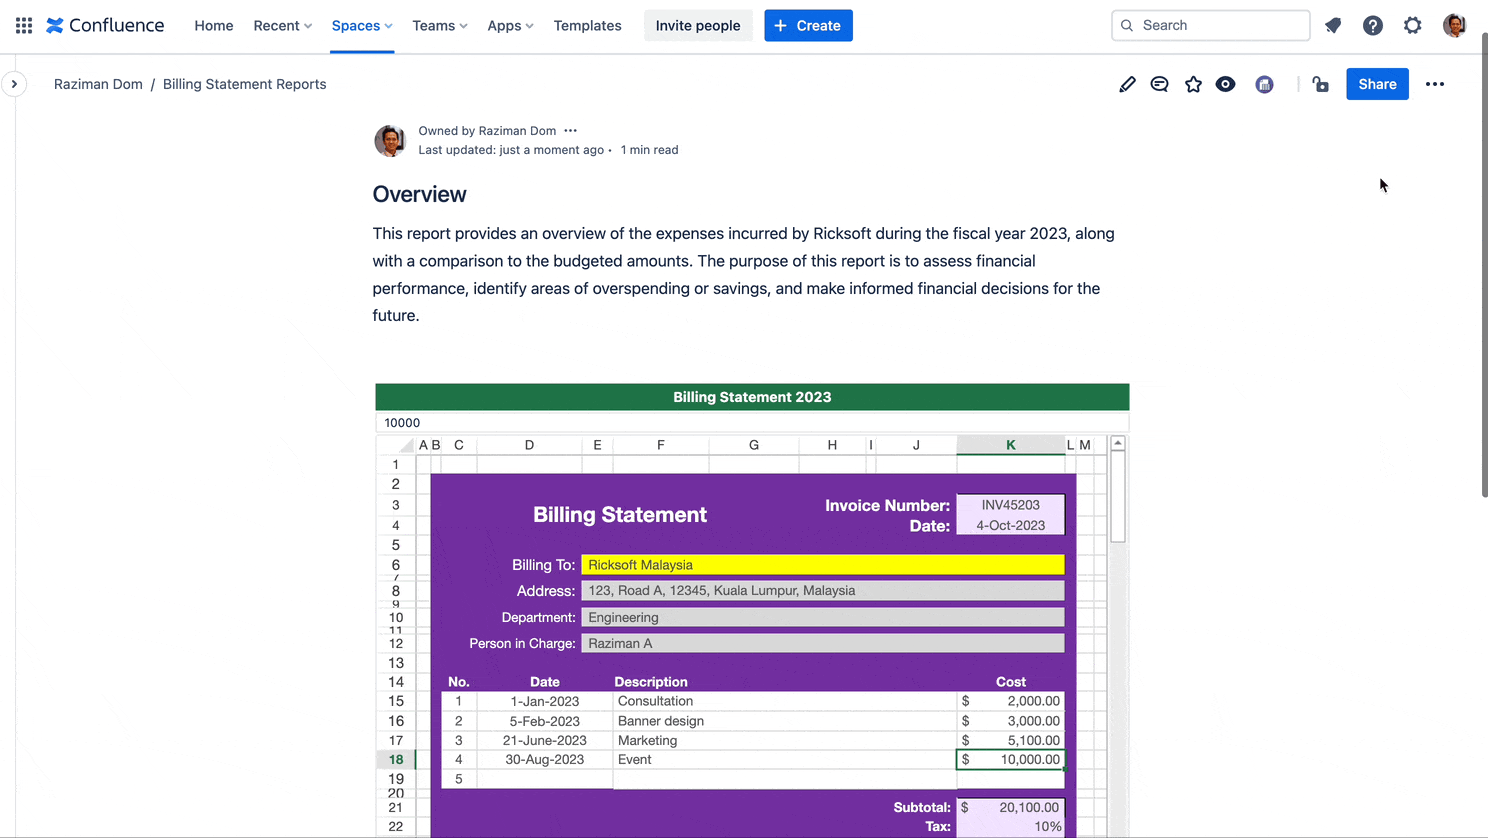
Simplify and streamline financial data management in Confluence with Excel-like Tables for Confluence. With a few simple clicks, create comprehensive tables, embed spreadsheets, perform calculations, and build data visualizations—all directly within Confluence( even in fullscreen mode). Eliminate the need to constantly switch screens and attach external files or links.
Apply Formulas and Calculate Your Expenses without Relying on External Tools
Utilize over 450 built-in formulas for precise expense calculations, ensuring data accuracy and reliability. Perform data processing operations just like you would in Excel—all within Confluence. This simplifies your financial data management, making it efficient and collaborative.
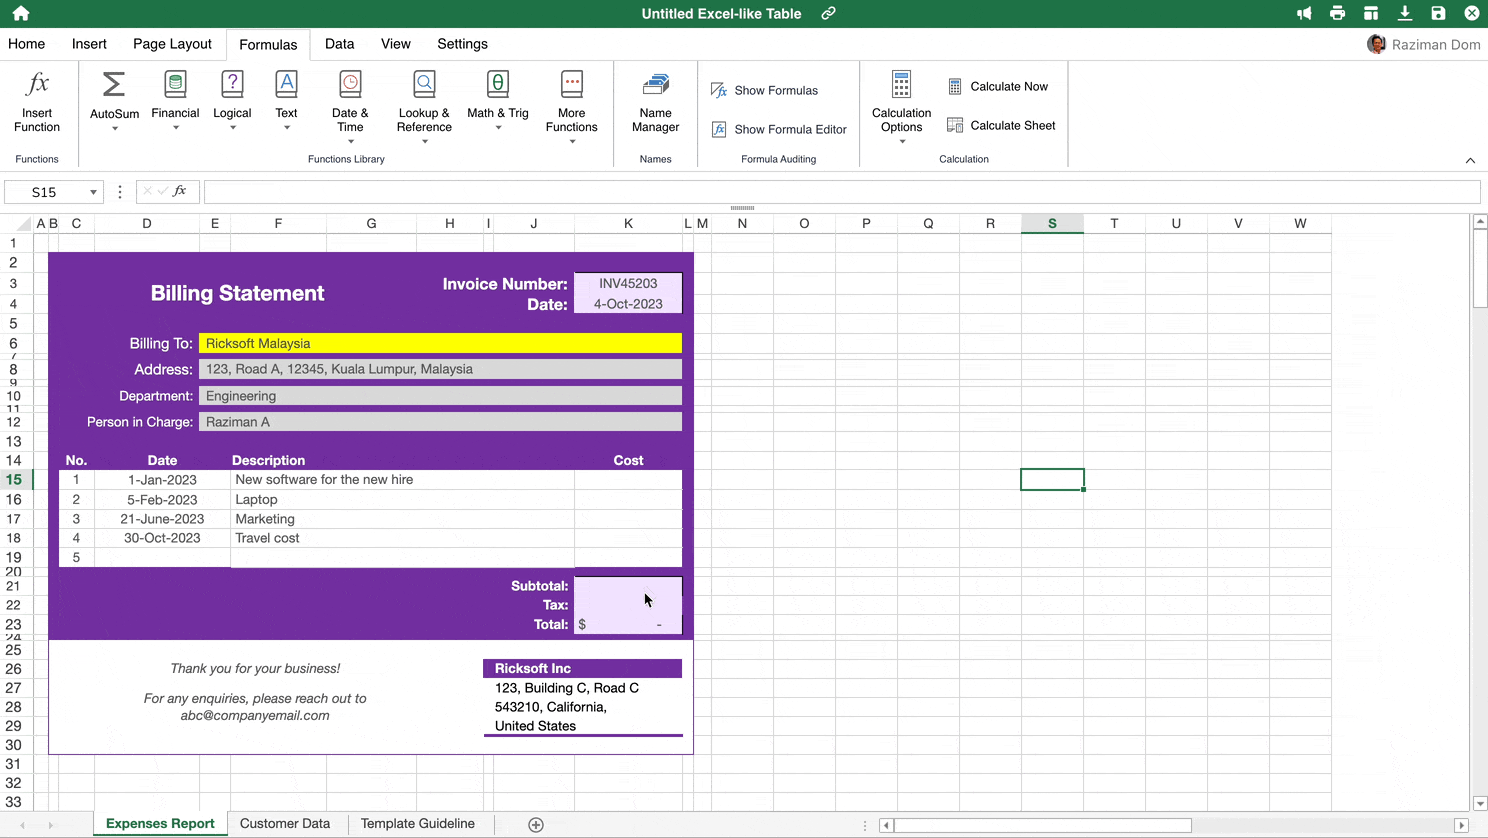
Prepare Financial Earnings Reporting Directly in Confluence
Eliminate the need to switch between platforms like Google Sheets, Excel, and Google Docs when preparing your financial earnings reporting. Excel-like Tables for Confluence consolidates all financial data on one page. Copy, paste, and import content from the above platforms and organize your data in Confluence easily.
Create Visually Engaging Financial Reports and Overcome Confluence’s Native Limitations
Using the app’s expanded table view and data visualization capabilities, you can represent your financial data graphically. Easily generate charts and graphs within your Confluence pages, making your financial reports more engaging and easier to understand.
Attach a Pre-Configured Table Template to Simplify Reporting
Create templates based on saved work. You can set up a standardized financial report format and reuse it for future reports. This not only saves time but also ensures consistency across your financial documents.
Collaborate on Your Financial Reports Effectively and See Changes in Real-time
Excel-like Tables for Confluence’s real-time live table editing feature allows your team to collaborate seamlessly. Work on the same report simultaneously and instantly see each other’s changes. This optimizes collaboration and ensures that your financial reports are always up-to-date.
Centralize Your Finance Report Tracking in Confluence to Maintain a Single Source of Truth
Using multiple tools and platforms to manage your data will not only create new errors, but also lead to process redundancies and file duplication. Maintain a single source of truth and enable better data visibility by centralizing your finance tracking in Confluence.
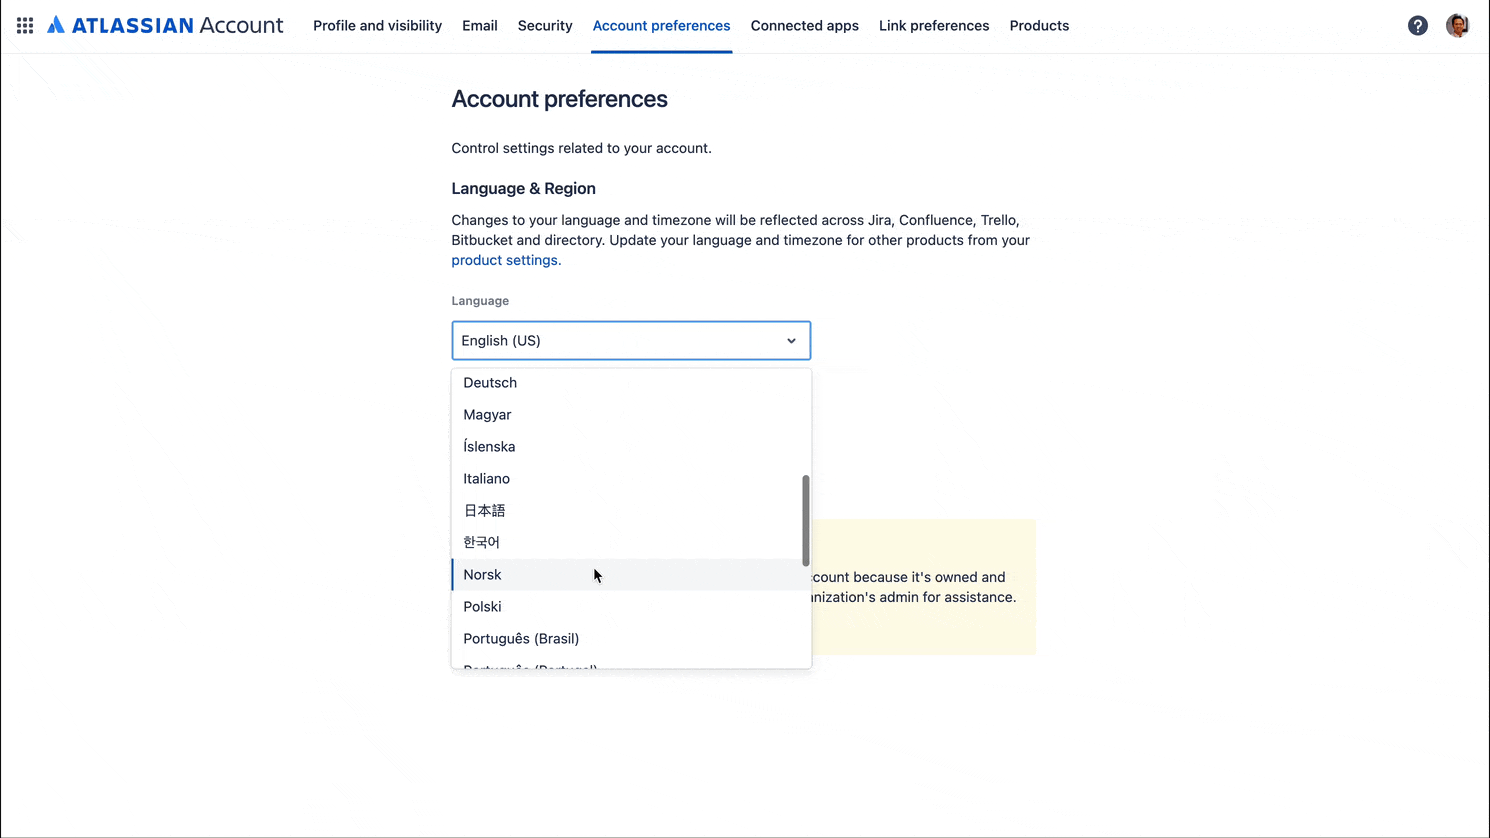
Present Your Financial Reportings in Other Languages and Boost Localization Efforts
Excel-like Tables for Confluence offers support for nine languages, making it easier for diverse teams to collaborate on financial reports. View your tables in Japanese (日本語), Chinese Simplified, Korean (한국어), German, French, Spanish (Español), Swedish (Svenska), Portuguese (Português), and Italian (Italiano).