Topic
- Reporting & Data Visualization
Featured Apps
Table of Contents
Challenge
Status reports and review pages often rely on data copied from other sources. Manually updating those reports every week or month is time‑consuming and error‑prone—especially when the underlying data changes frequently.
Solution
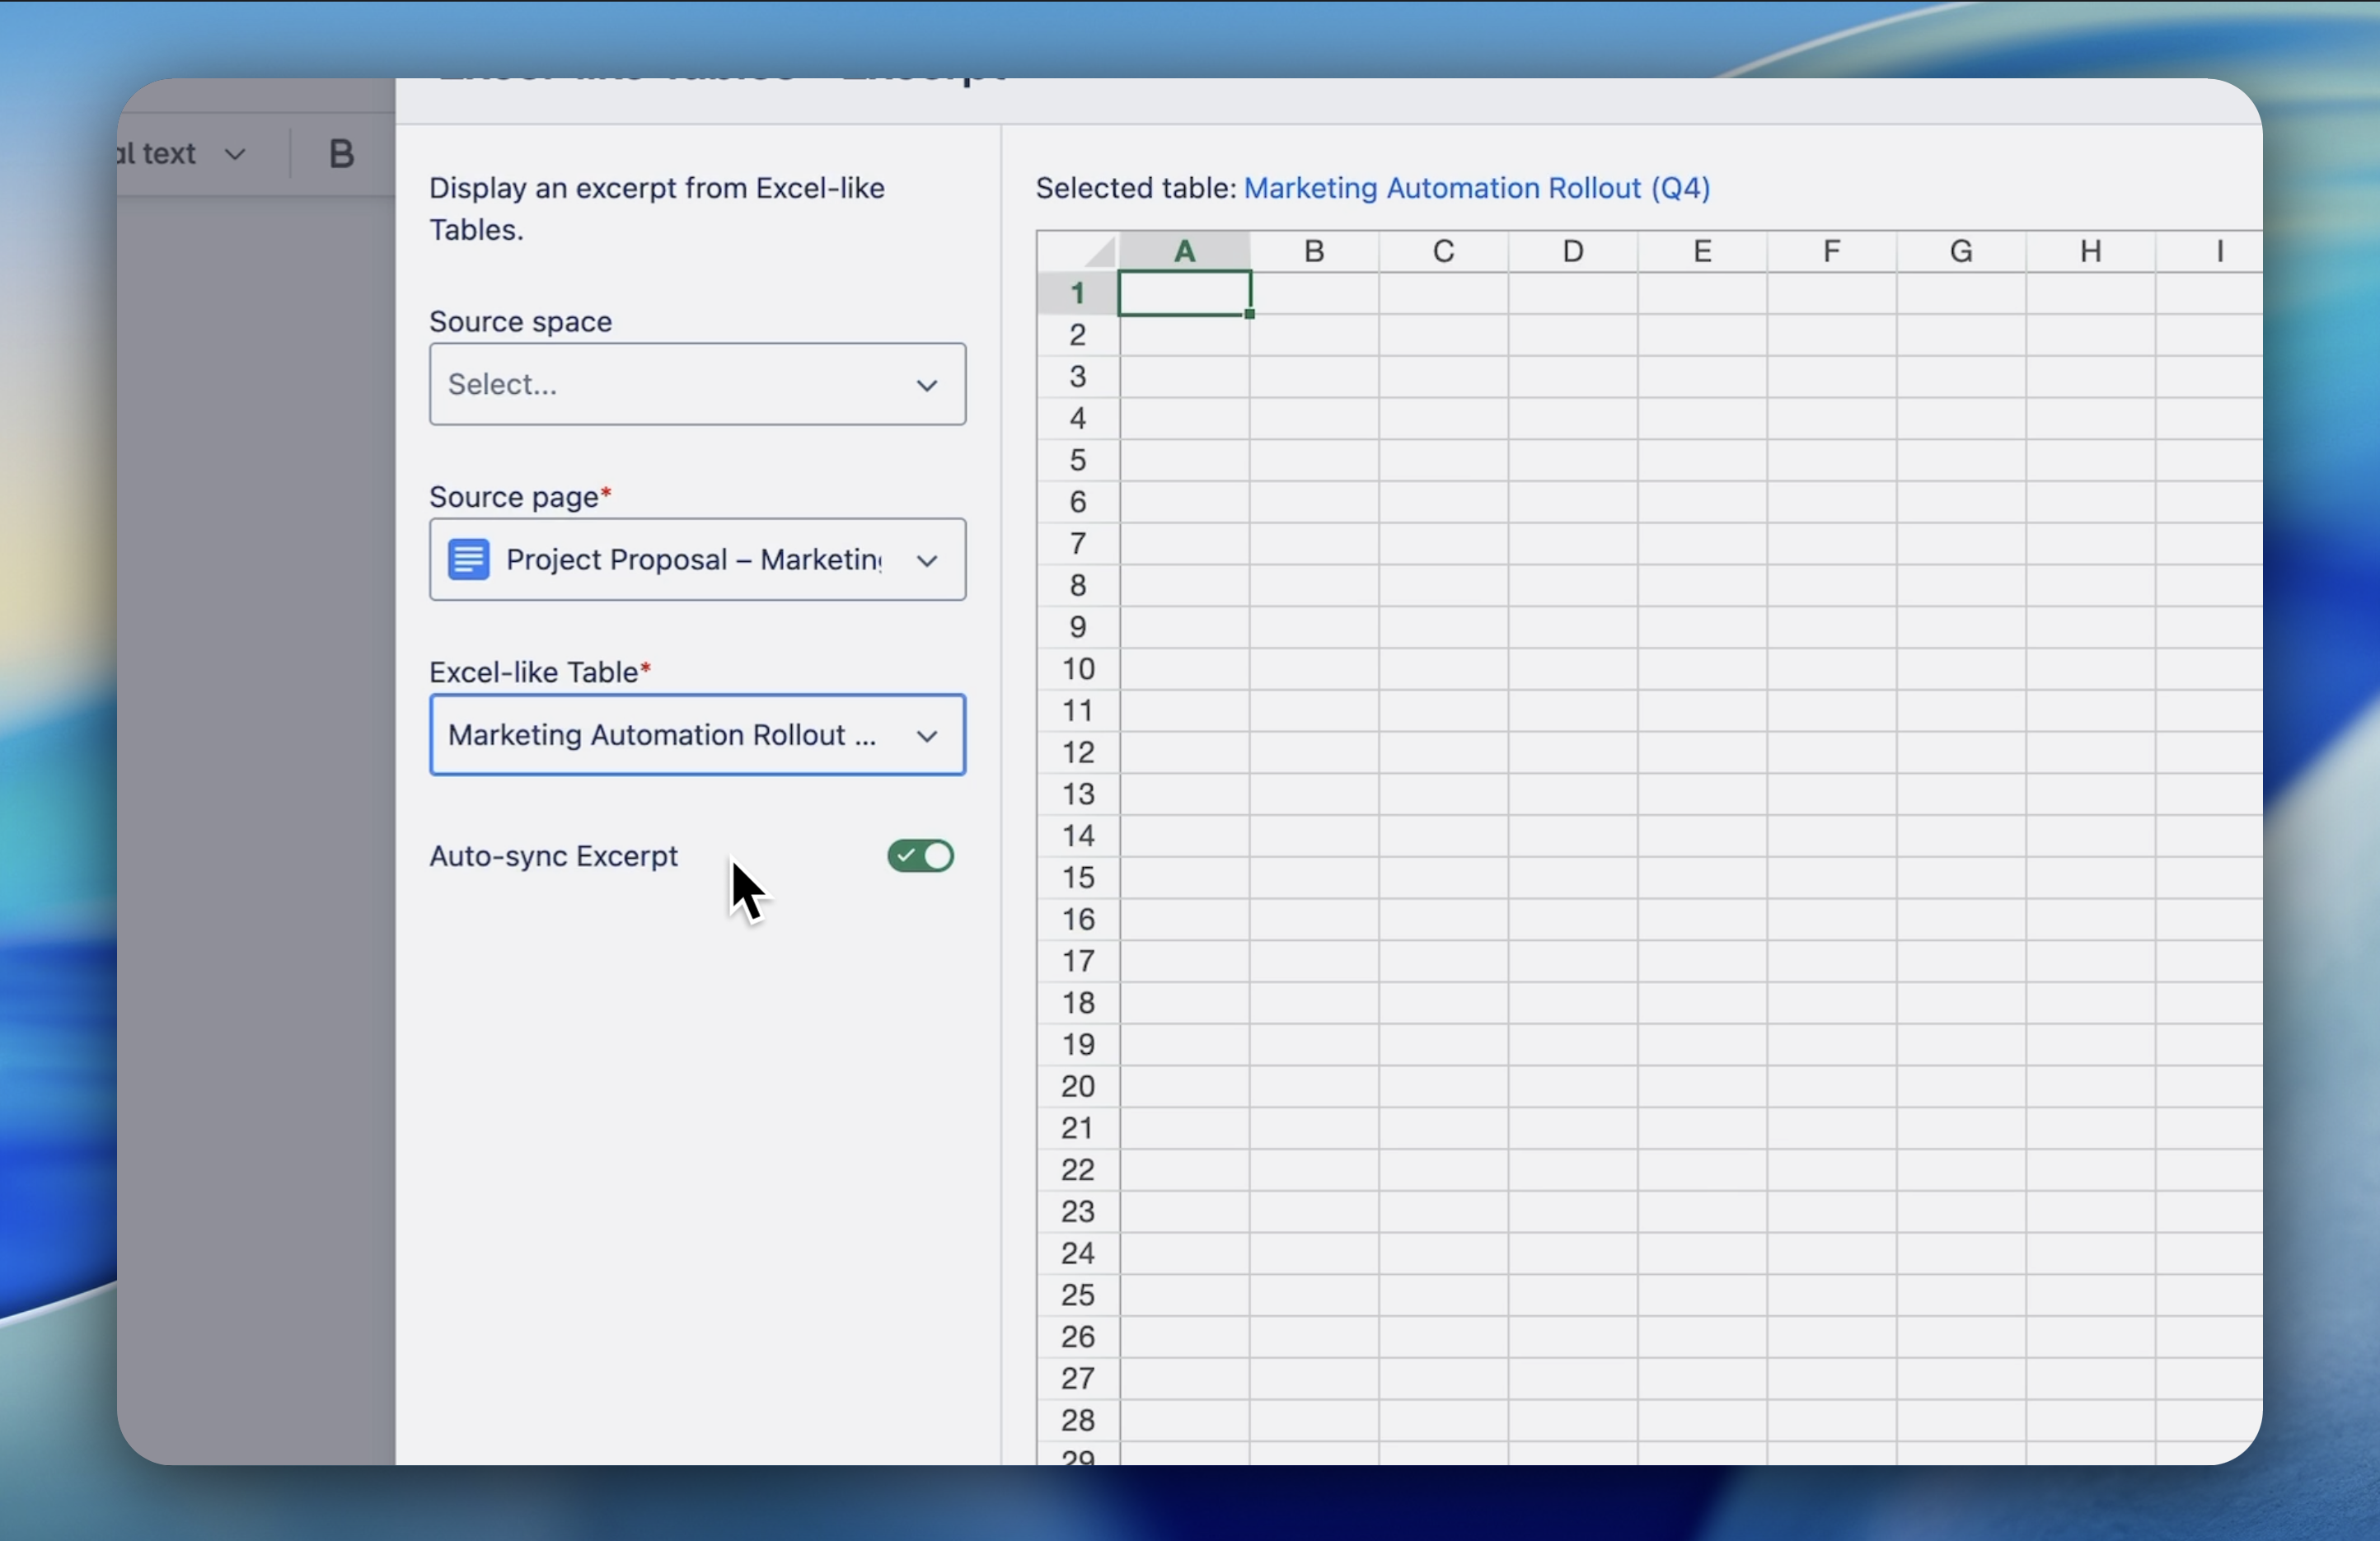
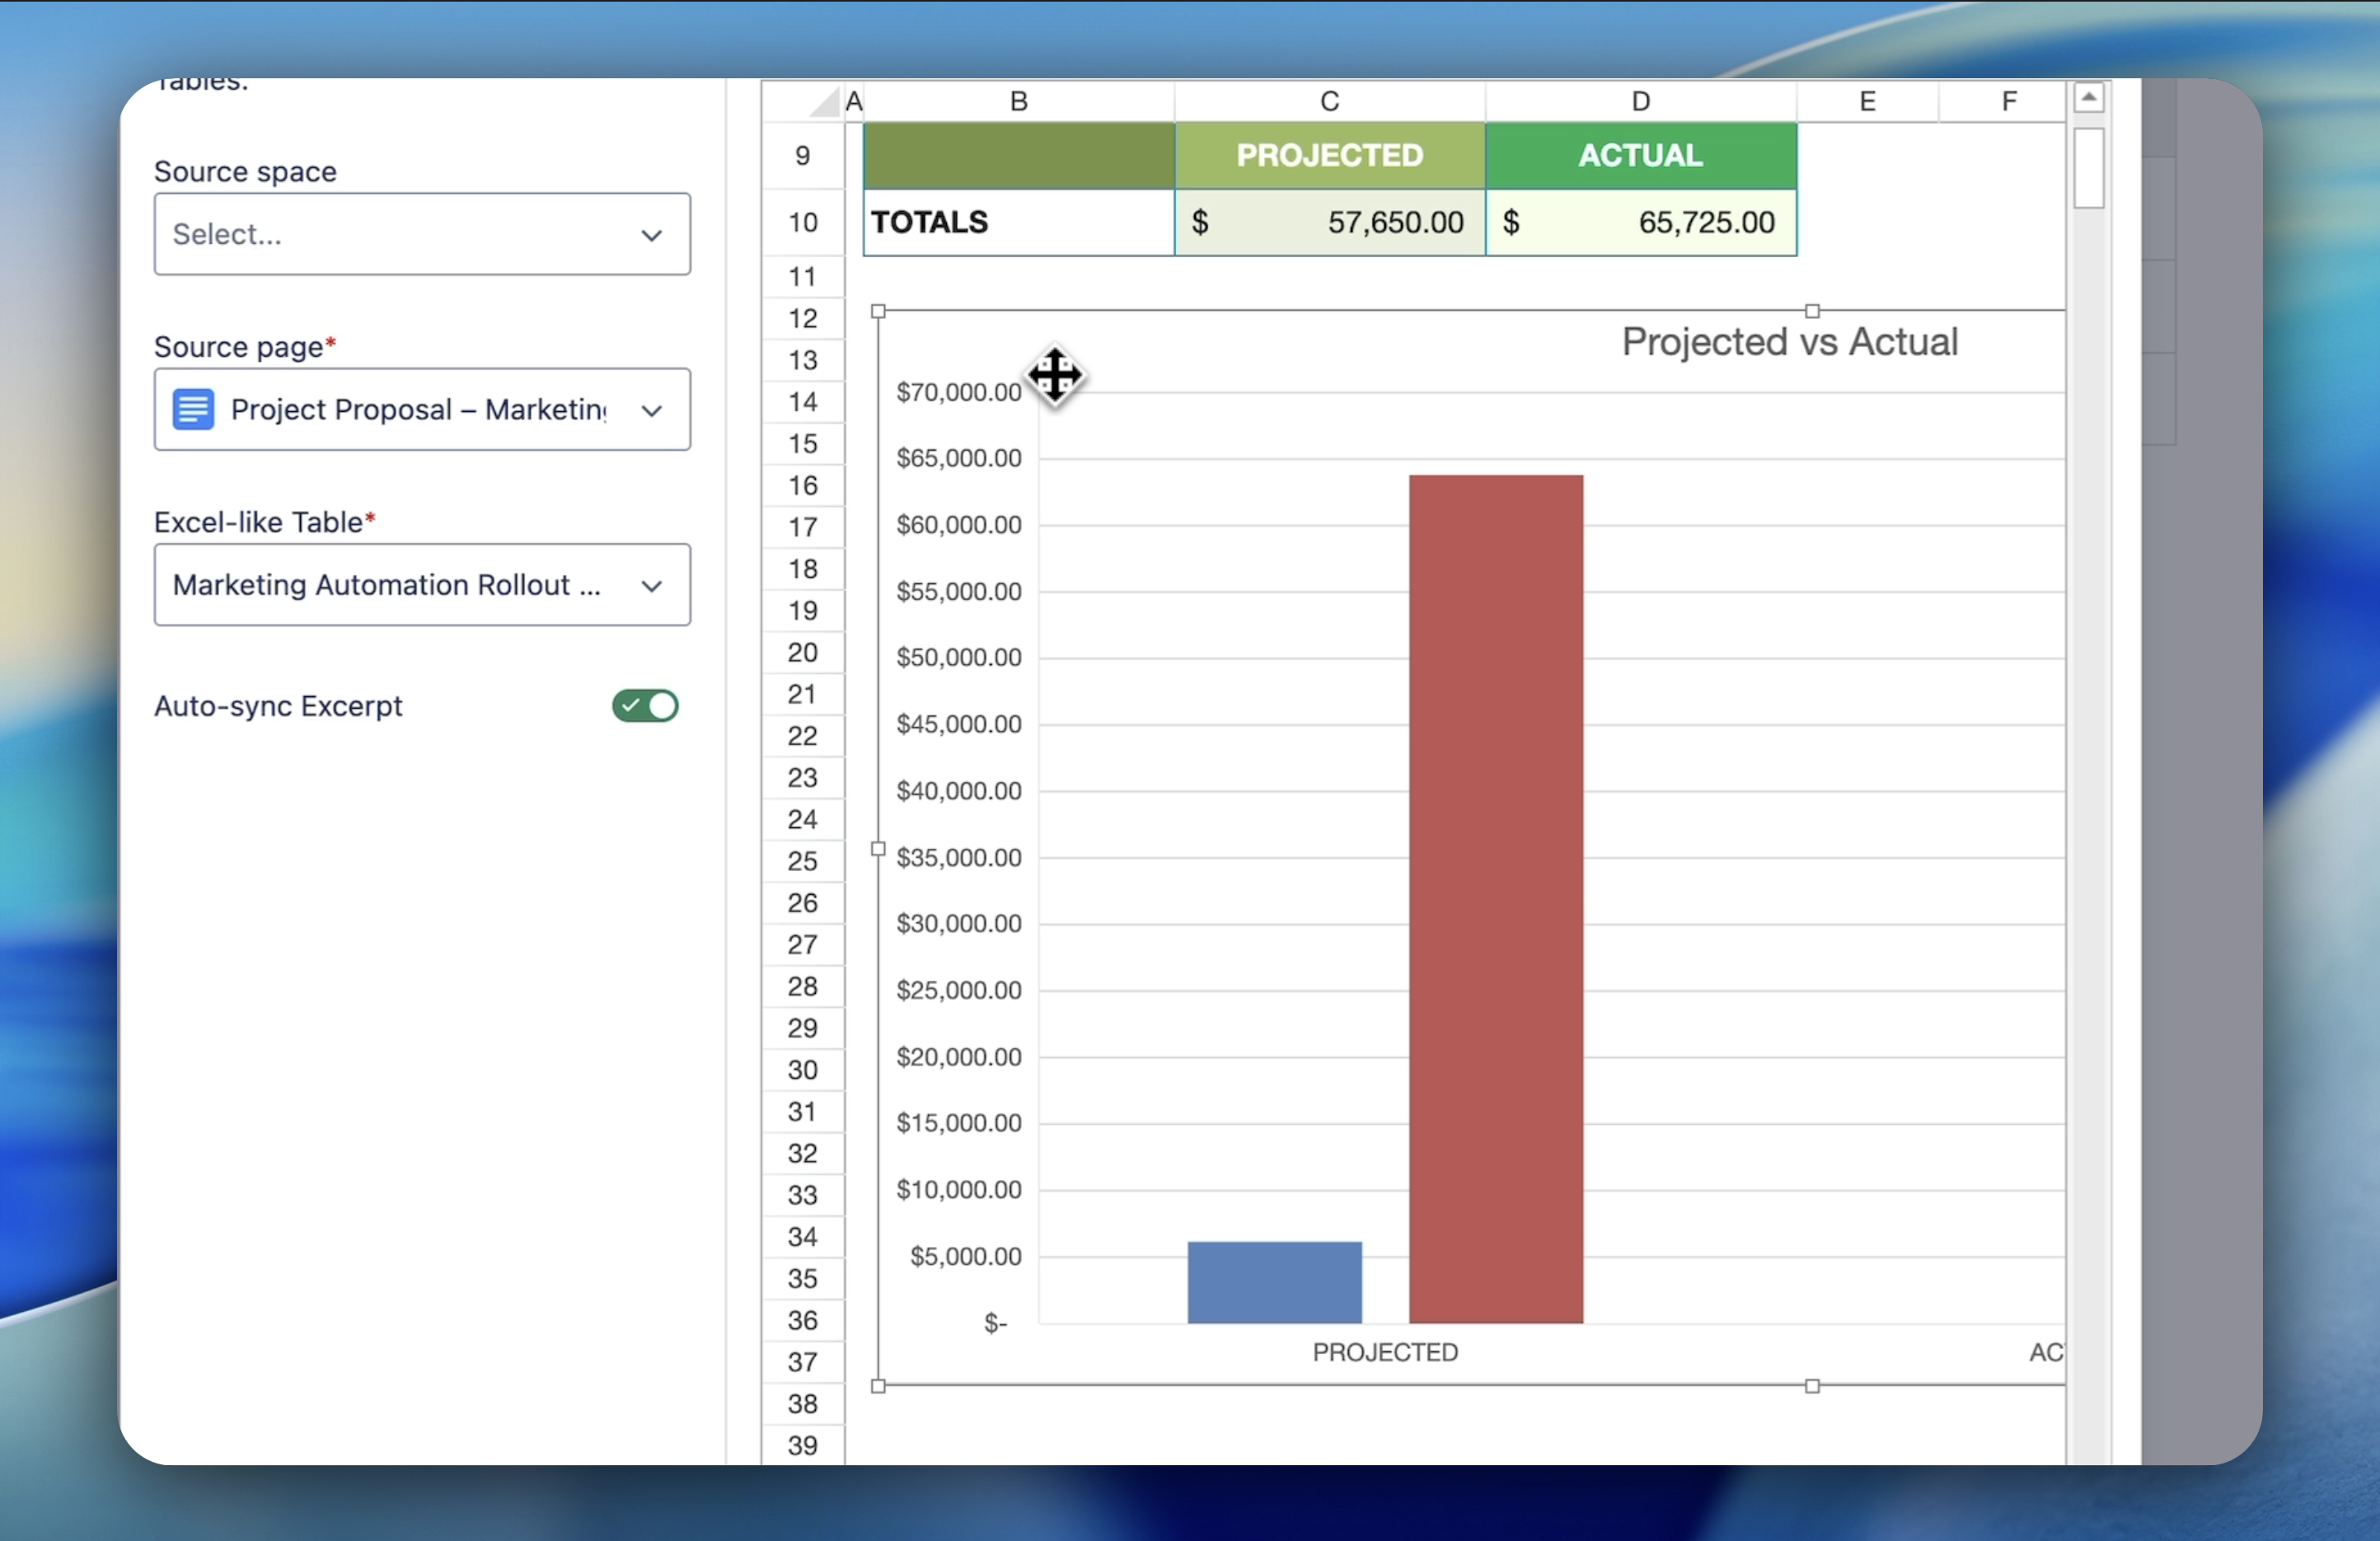
With Excerpt Macros, you can embed live data from your main table directly into your reporting and review pages. Your charts, key metrics, and table snippets will always stay in sync with the source, so your reports are accurate without extra effort.
Get Started
-
Prepare or identify your main Excel table with the data you want to report on.
- Go to your reporting or review page in Confluence and click Edit.
-
Insert the appropriate excerpt macro:
-
/Excerpt Single Cell – to highlight key numbers like totals or KPIs.
-
/Excerpt Range – to show specific rows and columns relevant to your report.

-
/Excerpt Chart – to show trends and visual summaries.

-
In the macro settings:
-
Select the source page where your Excel table or chart lives.

-
Select the table or chart block.

-
Define the exact cell, range, or chart you want to display.
-
Click Excerpt and publish your page.
Example
A finance team creates a monthly review page that shows:
-
A chart of departmental spend trends,
-
A range excerpt listing top vendor expenses,
-
A single cell showing total remaining budget.
Whenever the main budget table is updated, the review page reflects the changes instantly.
Need more help?
👉 See full documentation | Submit a support request