Topic
- Reporting & Data Visualization
Featured Apps
Table of Contents
Challenge
Teams often waste time manually copying data into multiple Confluence pages just to keep dashboards and status pages updated. This leads to errors, duplicate work, and stale information.
Solution
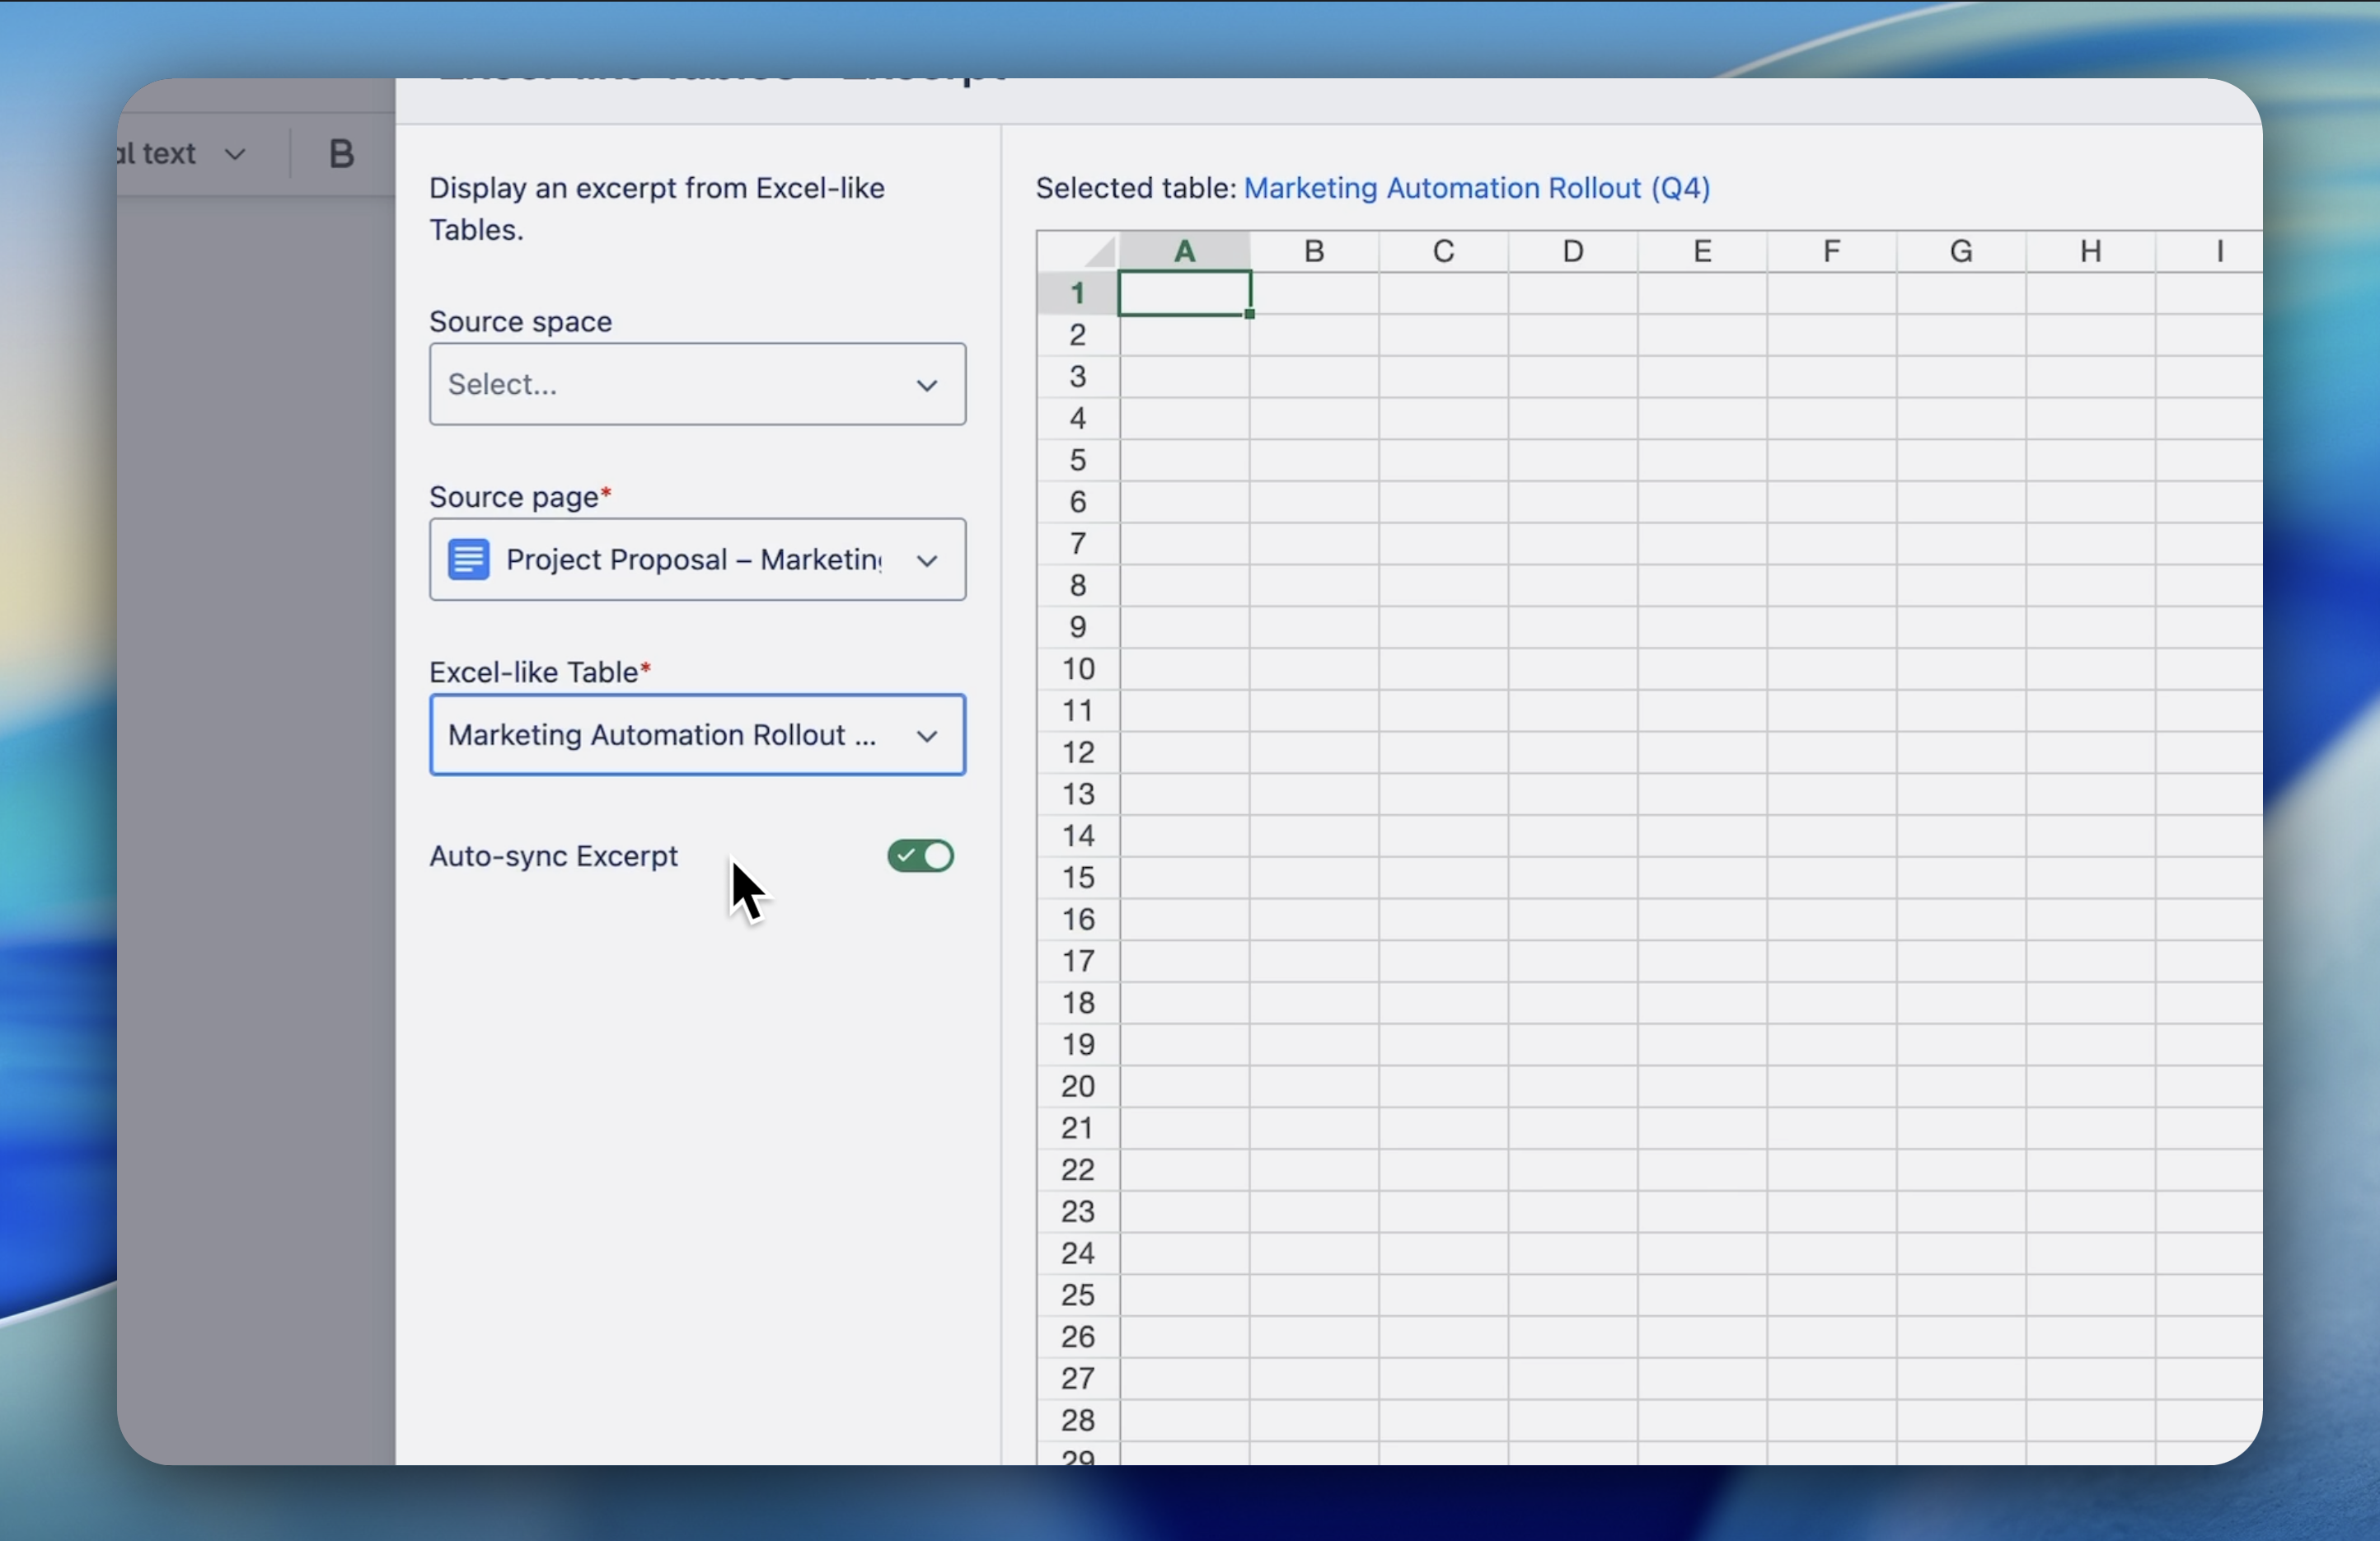
With Excerpt Macros, you can pull charts or data directly from your main table into different Confluence pages. Whenever the source table updates, your dashboard updates too, automatically.
Get Started
-
Go to the page where you want to display the data and click Edit.
-
Choose the right excerpt macro for your needs:
-
/Excerpt Single Cell – to show one data point.

-
/Excerpt Range – to show a block of rows and columns.
-
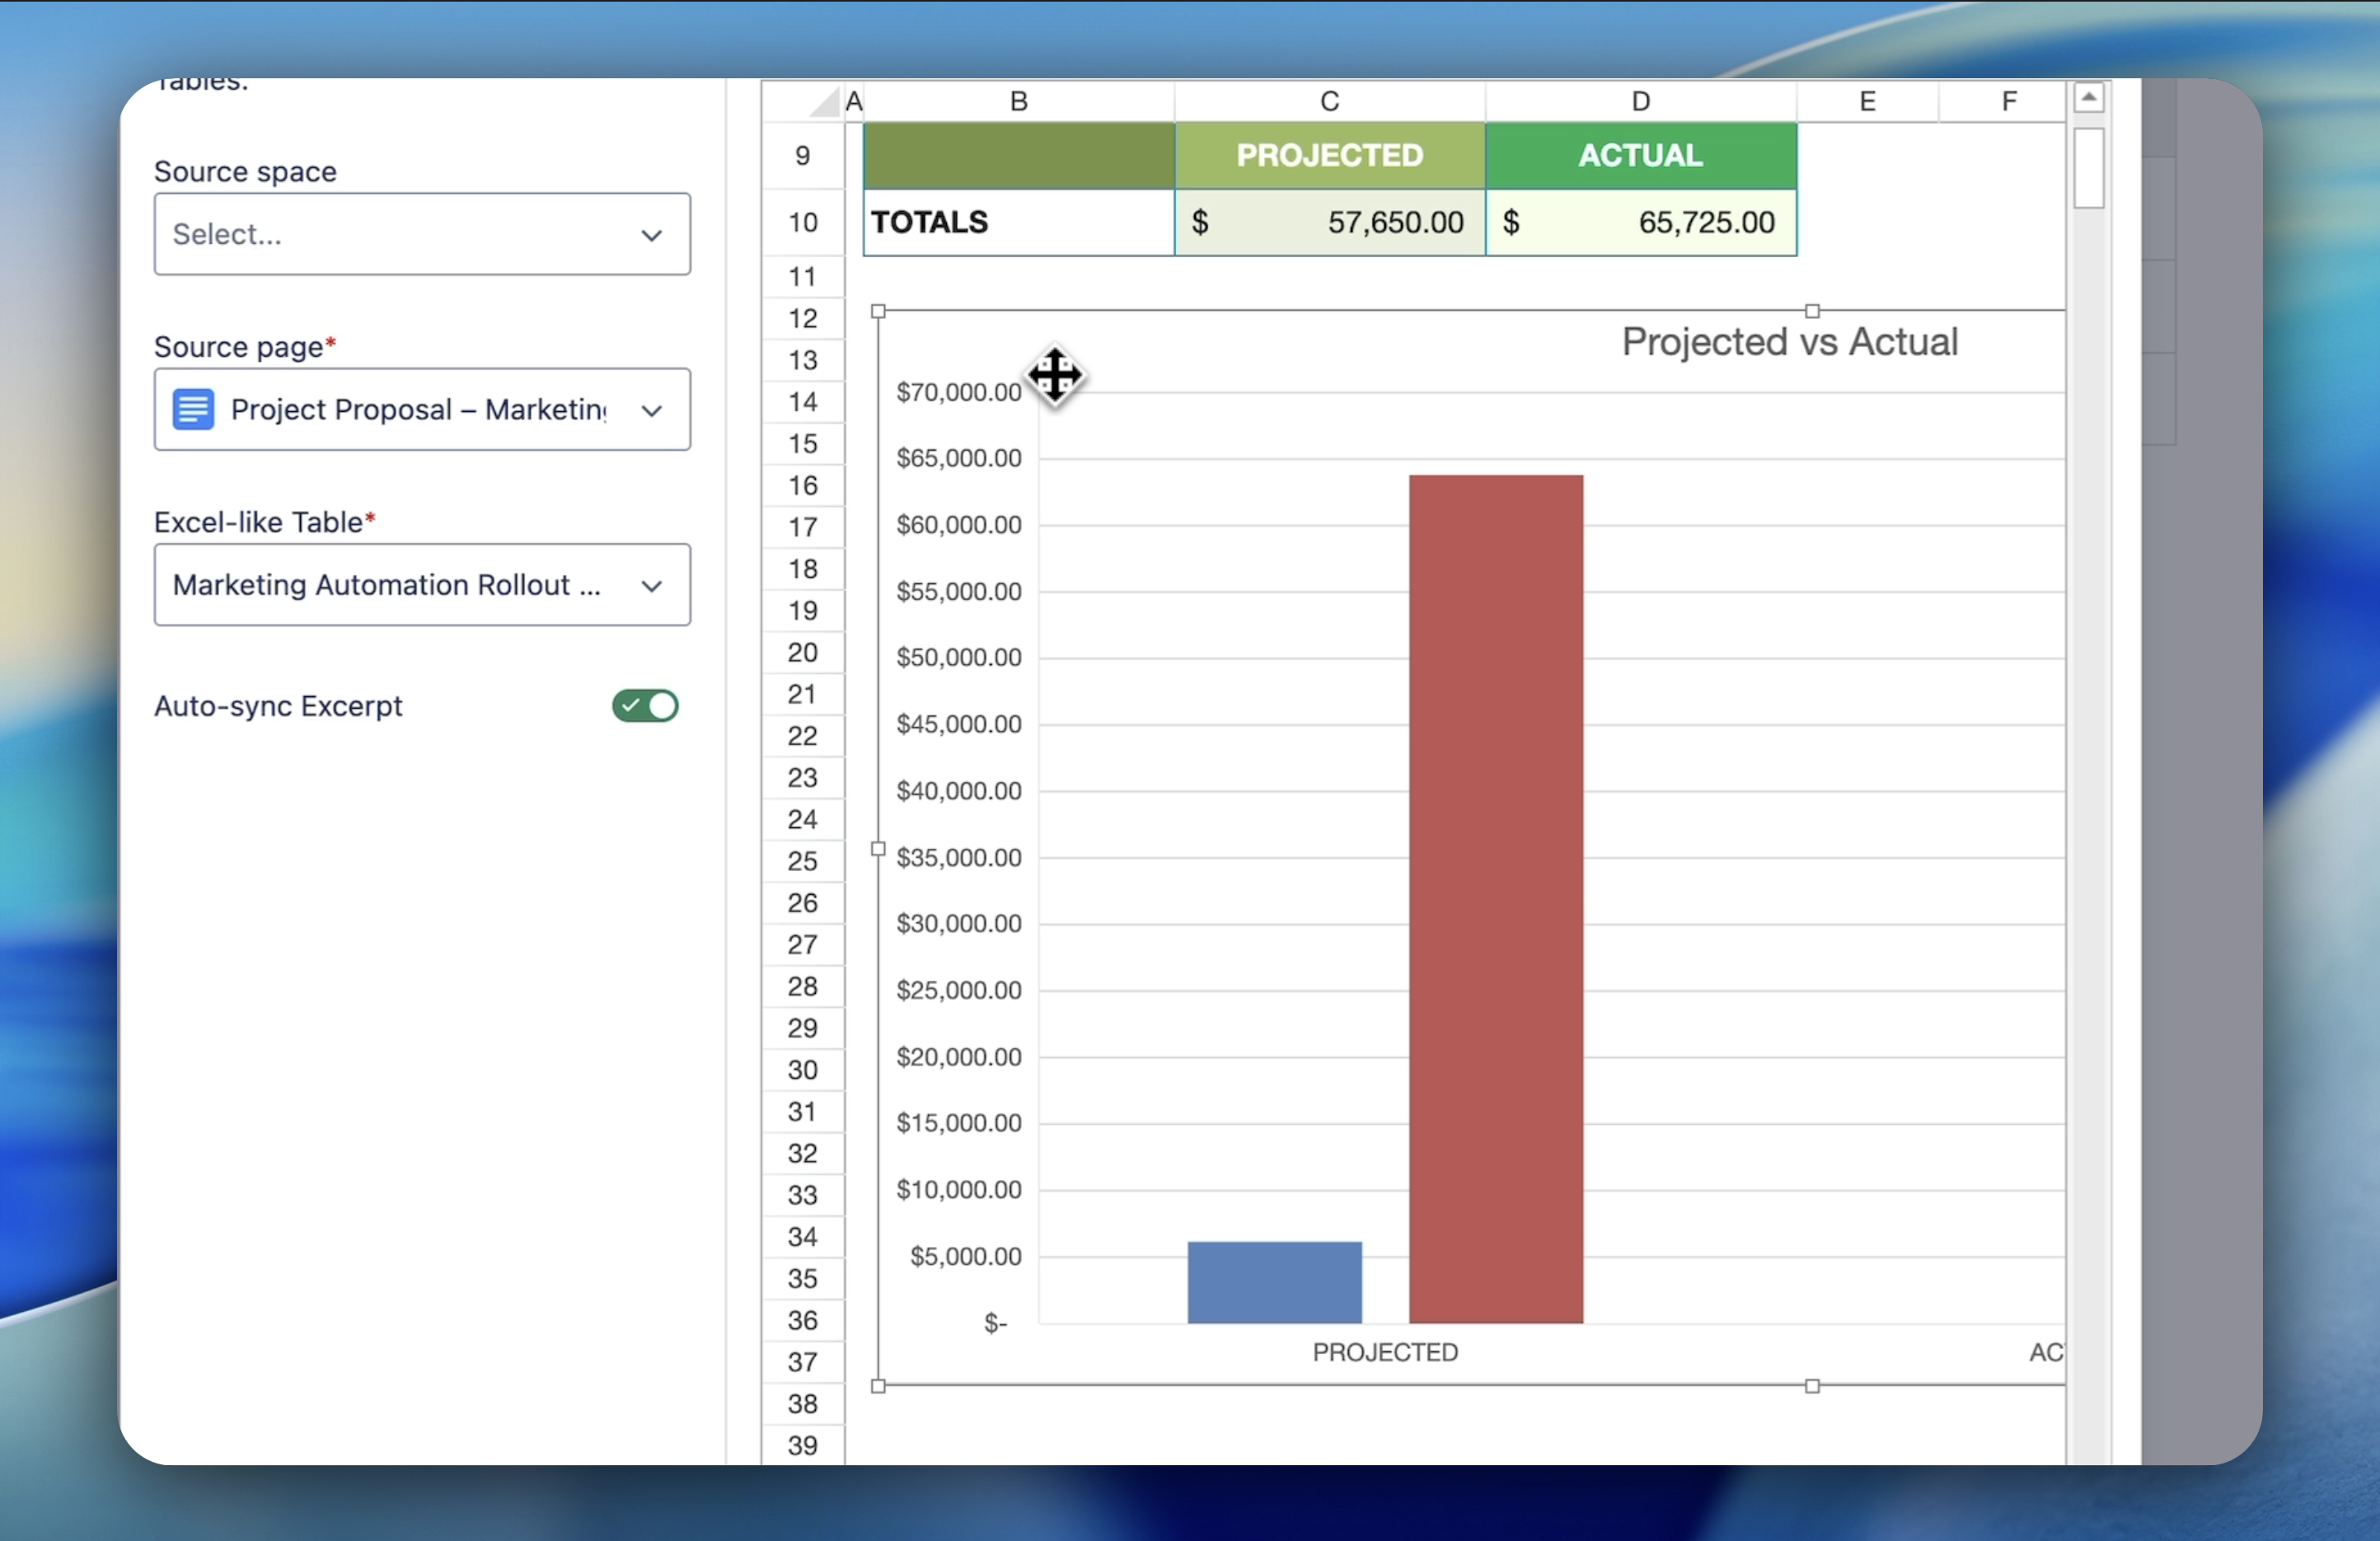
/Excerpt Chart – to show a live chart.

-
In the macro settings:
-
Select the source page where your Excel table or chart lives.

-
Select the table or chart block.

-
Define the exact cell, range, or chart you want to display.
-
Click Insert and publish your page.
Example
An operations team creates a live dashboard that shows:
-
A chart of project completion rates (via Excerpt Chart), and
-
A live mini‑table of critical tasks (via Excerpt Range)
All powered by the same master planning table, no manual updates needed.
Need more help?
👉 See full documentation | Submit a support request